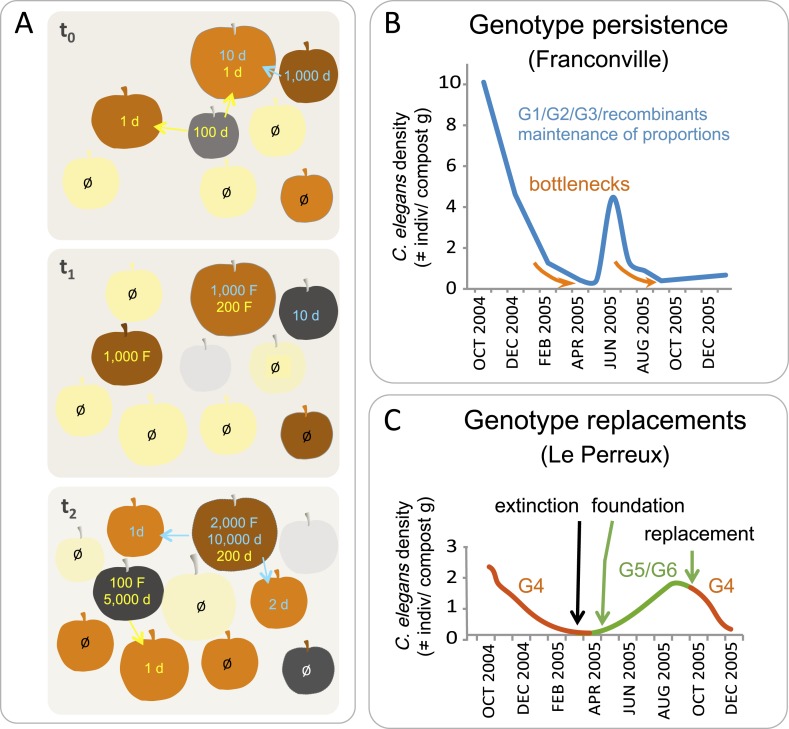
Figure 4. C. elegans population dynamics in a natural habitat.
(A) A schematic of C. elegans population dynamics in an orchard. Population growth on a given apple has not been monitored to date and so is inferred here from data in (Félix and Duveau, 2012), based on many time points in an orchard and single time points on a given fruit. The fruits are shown at three time points (t) in identical positions on each panel, with t0 the first and t2 the last timepoint. Fruit colors indicate the degree of fruit decomposition, from early stages (yellow) to brown and dark grey (later stages), until disappearance (light grey). The number of feeding (F) and non-feeding dauer (d) individuals are indicated in color, with different colors representing different genotypes. Ø represents no colonization of a fruit by C. elegans. Arrows indicate dauer migration. How often different fruits or stems are colonized by several genotypes remains to be tested (Barrière and Félix, 2007; Andersen et al., 2012). (B–C) Actual population dynamics at the scale of a compost heap, from Barrière and Félix (2007). (B) In the first (Franconville) example, three main genotypes, G1, G2 and G3, persist in the heap at similar frequencies over the time period shown. In the second example (Le Perreux-sur-Marne), a single genotype, G4, was present, became extinct, then two new genotypes, G5 and G6, founded a new population. G4 reappeared in September, while G8 and G9 (not shown) disappeared. Genotypes were characterized using microsatellite markers.

