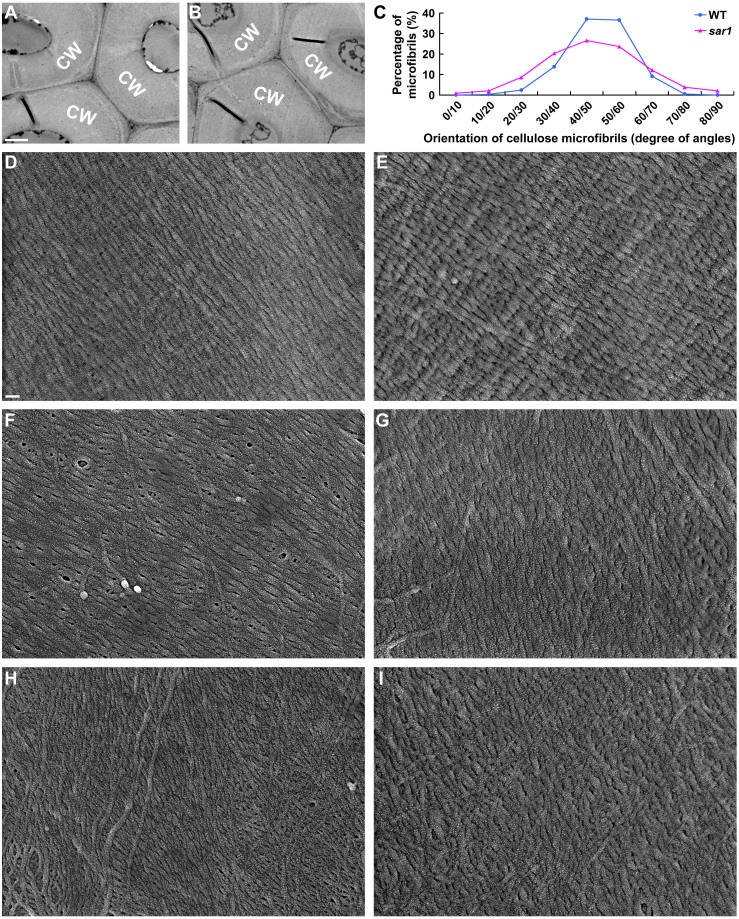
Figure 3. Sclerenchyma cells of sar1 show abnormalities in the orientation of cellulose microfibrils in secondary cell walls.
(A–B) Transmission electron micrographs of the sclerenchyma cell walls (CW) of WT (A) and sar1 (B) stems. (C) Quantitative analysis of cellulose microfibril orientation in cells where microfibrils were neatly aligned parallel to each other. Sclerenchyma cells in the stem elongation zone showed three different types of cellulose microfibril arrays, exemplified in D and E, F and G, H and I, respectively. Representative images of cell walls from WT and sar1 cells (4–5 cells from 3 different plants) with microfibril arrays as those in D (WT) and E (sar1) were used to measure microfibril orientation. The direction transverse to the elongation axis is defined as zero degree. The horizontal axis shows the orientation of cellulose microfibrils divided into groups, e.g. 0/10 indicates the orientation ranges from more than 0 degree to less than or equal to 10 degree in this group. (D–I) Scanning electron micrographs of cellulose microfibrils in the innermost layer of WT (D, F, H) and sar1 (E, G, I) sclerenchyma cell walls. Scale bars = 1 µm in (A) for (A) and (B), in (D) for (D) to (I).

