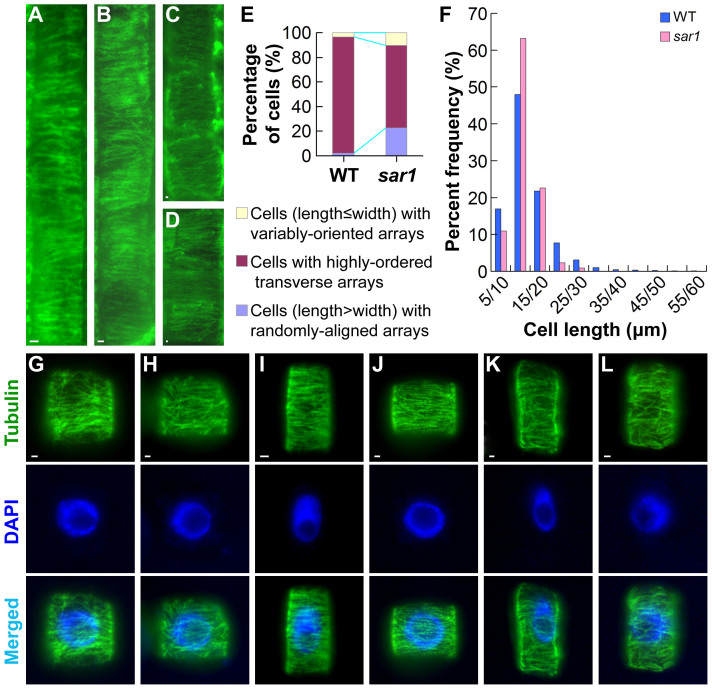
Figure 4. sar1 shows reduced transverse orientation of cortical microtubules.
(A–D) Immunofluorescence of microtubules in the elongating epidermal (A and B) or parenchyma (C and D) cells of WT (A and C) and sar1 (B and D) stems. (E) Percentage of root cells at the early, rapid and late elongation stages that have microtubule arrays exemplified in (G and H), (I and J) and (K and L), respectively (n = 877 and 517 cells from 10 different plants for WT and sar1, respectively). (F) Percent frequency distribution of root cells with highly-ordered transverse microtubule arrays (n = 831 and 345 cells from 10 different plants for WT and sar1, respectively). The horizontal axis shows the cell length divided into groups, e.g. 5/10 indicates the cell length ranges from more than 5 µm to less than or equal to 10 µm in this group. (G–L) Immunofluorescence of microtubules in cells at the root elongation zone of WT (G, I and K) and sar1 (H, J and L). Bar = 1 µm in (A–D) and (G–L).

