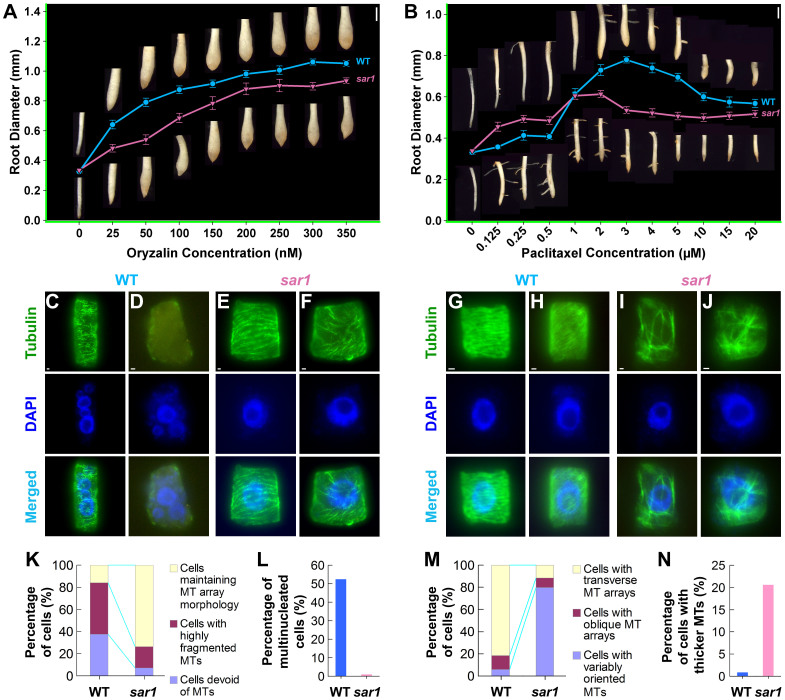
Figure 5. sar1 differentially responds to anti-microtubular drugs.
(A) sar1 is more resistant to microtubule depolymerizing drug oryzalin. (B) sar1 is more sensitive to microtubule stabilizing drug paclitaxel. Values of solid curves show the mean root tip diameters of WT (closed cycles, blue line) and sar1 (inverted triangles, red line) at each treated concentration. Error bars show the standard errors of the mean from triplicate experiments. Light stereomicrographes of root tips from WT and sar1 seedlings treated with anti-microtubular drugs are shown on the upper and lower sides of the curves, respectively. The bars are 1 mm, represented by the white vertical lines on the upper right corners of (A) and (B). (C–J) Microtubule (MT) phenotypes in elongating root cells of WT (C, D, G and H) and sar1 (E, F, I and J) after 250 nM oryzalin (C–F) or 25 μM paclitaxel (G–J) treatment. Bar = 1 µm in (C) to (J). (K–N) Quantitative analysis of microtubule phenotypes caused by oryzalin (K and L) or paclitaxel (M and N) treatment; n = 1117–1556 cells from 6–8 different plants.

