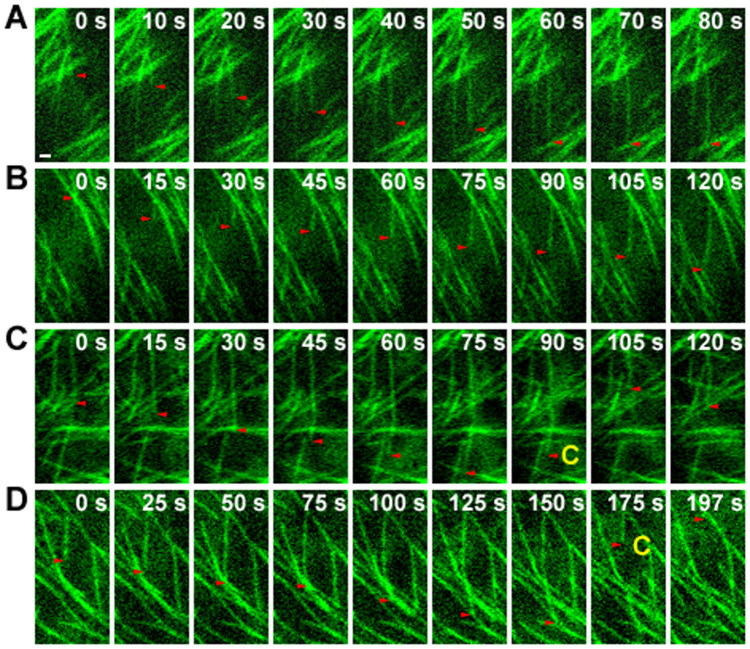
Figure 6. The dynamic instability behavior of individual microtubules is altered in sar1.
(A–D) Sequential images from time-lapse movies of WT (A and C) and sar1 (B and D) cells expressing EGFP-tagged α-tubulin. Red arrowheads track the plus ends of selected microtubules. White numbers indicate the elapsed time (seconds). Yellow letter C highlights microtubule catastrophe events (switches from growth to shrinkage). Scale bar = 1 µm in (A) for (A) to (D). See the entire series in Supplemental Movie 1 to 4 that correspond to panel A to D, respectively.

