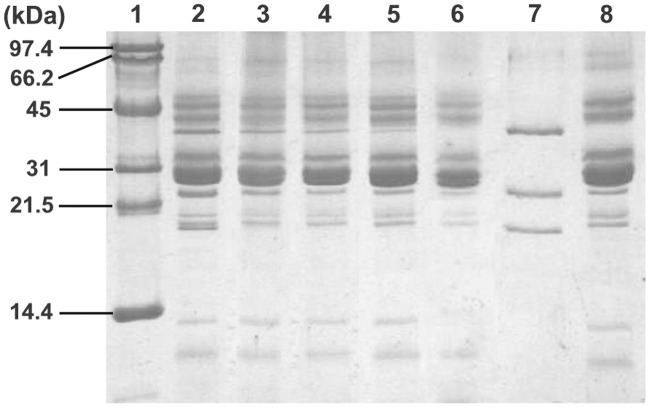
Fig 3. SDS-PAGE polypeptide profile of PSII submembrane fractions treated with different concentrations of Al3+.
Lane 1, molecular weight standards; lane 2, control PSII; lane 3, 1 mM Al3+ treated PSII; lane 4, 2 mM Al3+ treated PSII; lane 5, 4 mM Al3+ treated PSII; lane 6, 5 mM Al3+ treated PSII; lane 7, supernatant of the Tris-alkali treated PSII; lane 8, Tris-alkali treated PSII. Numbers on the left side indicate the masses (in KDa) of molecular markers. See details in the "Materials and methods" section.

