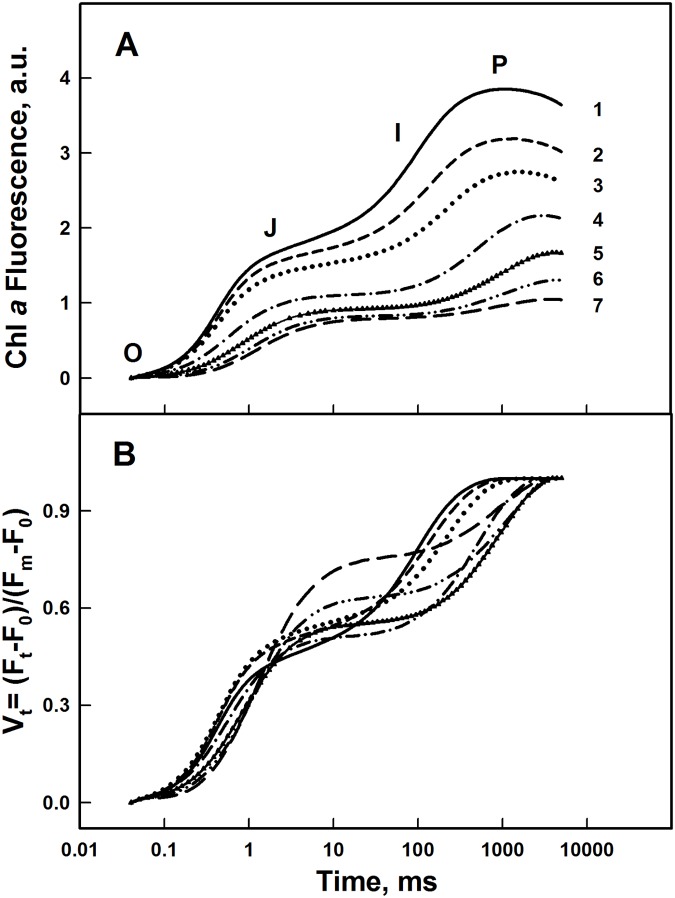
Fig 5. OJIP traces of Chl Fluorescence induction.
(A) of PSII submembrane fractions treated with different concentrations of Al3+. (1) Control, (2) 1 mM, (3) 1.5 mM, (4) 2 mM, (5) 3 mM, (6) 4 mM, (7) 5 mM; (B) normalized at both initial and maximal intensities. Each curve is the average of nine independent measurements. See details in the Materials and Methods.

