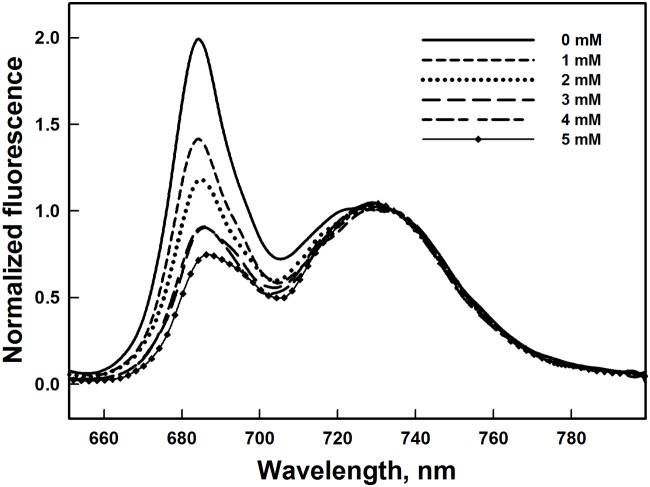
Fig 6. Changes in the Low temperature (77 K) chlorophyll fluorescence emission spectra of thylakoids membranes exposed to different Al3+ concentrations.
The slit widths for excitation and emission were set at 5 and 2.5 nm, respectively. Spectra were normalized at 732 nm. The presented spectra are representative of three separate experiments.

