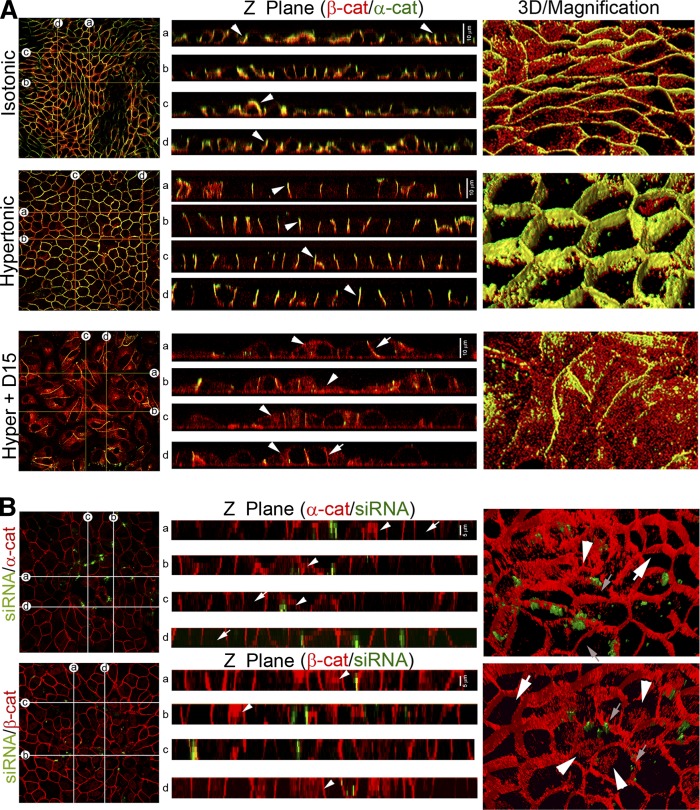
Fig. 6.
Z-plane and 3D reconstruction. SMS inhibition and knockdown. A: Z-plane cross-sections across the monolayer were generated (a–d). Analysis of z-planes (Z Plane) showed β- and α-catenin in the periphery of the cells, both under isotonicity and under hypertonicity (white arrowhead). In cells treated with 15 µM D609, cell-cell adhesion was impaired and the peripheral localization of α- and β-catenin is lost (Hyper+D15, white arrow). Cytosolic β-catenin was observed (Hyper+D15, white arrowhead). 3D reconstructions were performed from the optical sections (3D/Magnification). Under isotonicity, cells presented an elongated phenotype while under hypertonicity presented a cobblestone-like morphology (Hypertonic, 3D/Magnification). D609 treatment impaired the acquisition of the differentiated phenotype (Hyper + D15, 3D/Magnification), showing β-catenin intracellular accumulation. B: Effect of SMS1 knockdown on AJ formation and cell morphology, α- and β-catenin (red fluorescence in both cases). The green fluorescence corresponded to transfection control. Analysis of z-planes (Z Plane, α-cat and β-cat) showed that images from transfected cells (arrowhead) present a mislocalization of both catenins, with a clear cytoplasmic β-catenin distribution (Z Plane, β-cat, arrowhead). No alteration is observed in nontransfected cells, which present a cobblestone-like phenotype, with β-catenin peripherally distributed (white arrow). In α-catenin 3D/Magnification nontransfected cells (white arrow) present a peripheral distribution of α-catenin, whereas peripheral distribution is disrupted in transfected cells. In β-catenin 3D/Magnification nontransfected cells showed a peripheral distribution (white arrow), whereas transfected cells (white arrowhead) present intracellular distribution with accumulation in a structure that should be the nucleus. The small arrowhead indicates the transfection control.

