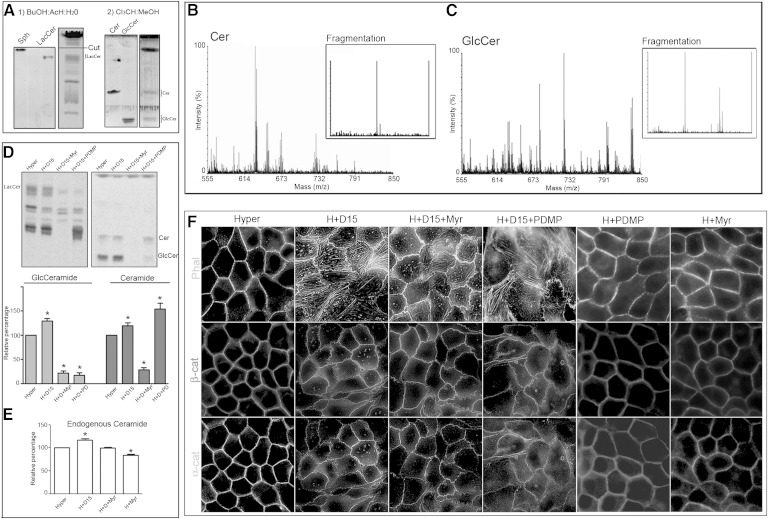
Fig. 7.
The alteration in differentiated phenotype acquisition by SMS inhibition is not due to Cer accumulation. A: Representative TLC performed as described in Materials and Methods, using butanol-acetic acid-water (60:20:20, v/v/v) as first solvent system and chloroform-methanol (98:2, v/v) as second solvent system. B, C: MALDI TOF/TOF mass spectrometry of chromatographic spots that comigrated with Cer and GlcCer standards. The intensity versus mass (m/z) graph shows most of the signals in the m/z 520–690 range in the Cer spot and signals in the m/z 682–808 range in the GlcCer spot. These m/z peaks are consistent with the possible Cer and GlcCer subspecies (different fatty acid carbon number). The molecular structures of Cer and GlcCer subspecies were confirmed by fragmentation, with the detection of two peaks at m/z for Cer and three peaks for GlcCer confirming their identities. D: Effect of SPT and GlcCer synthase inhibition on [14C]serine incorporation, in D609-treated cells. E: Endogenous content of Cer evaluated by cupric acetate reagent. F: Effect of SPT and GlcCer synthase inhibition on the D609-induced alteration of F-actin and α- and β-catenin (α-cat/β-cat) distributions.

