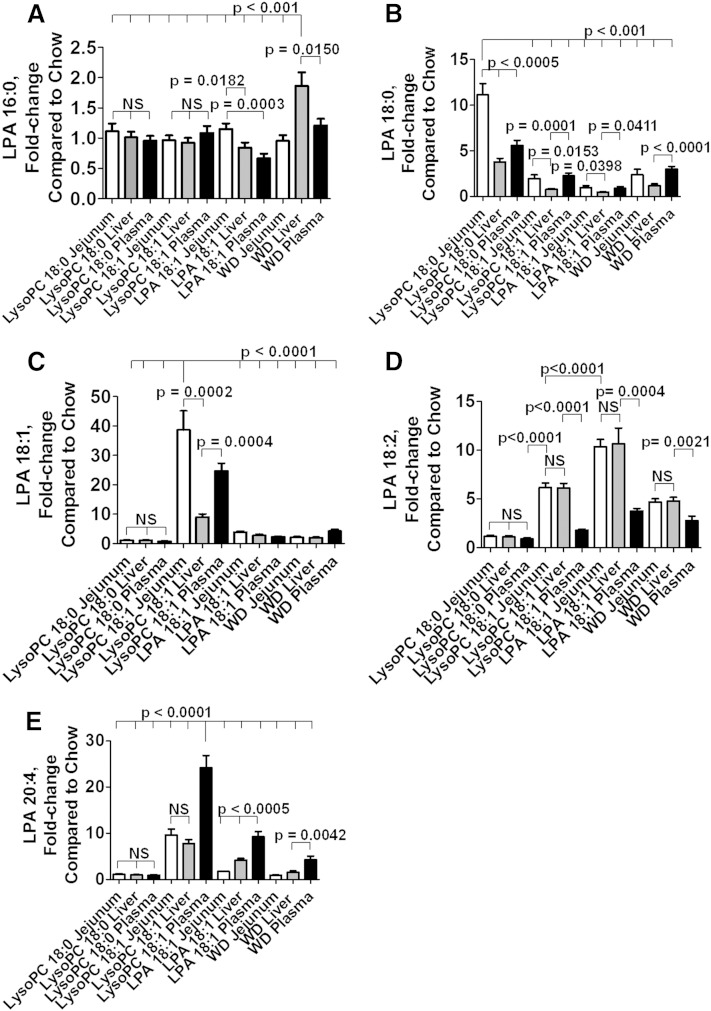
Fig. 11.
Directly comparing changes in jejunum, liver, and plasma. An average value was calculated for each LPA species in each tissue in mice receiving standard chow without supplements in Figs. 8–10. The fold-change compared with the average value on standard mouse chow without supplements was then calculated for each mouse on each diet (except for those that received PF8380), and for each LPA species in the mice described in Figs. 8–10. In each panel, the fold-change in the jejunum compared with standard mouse chow without supplements is shown in white bars. In each panel the fold-change in the liver compared with standard mouse chow without supplements is shown in the gray bars. In each panel the fold-change in the plasma compared with standard mouse chow without supplements is shown in the black bars. Comparisons for mice receiving PF8380 were omitted to reduce the number of bars in each panel. A: The fold-change in levels of LPA 16:0. B: The fold-change in levels of LPA 18:0. C: The fold-change in levels of LPA 18:1. D: The fold-change in levels of LPA 18:2. E: The fold-change in levels of LPA 20:4. The data shown are mean ± SEM. NS, not significant. In the case of multiple comparisons, the index condition to which the others are compared is indicated by a long vertical line (e.g., in A, the multiple comparisons shown at the top of the figure were to the values for WD liver).

