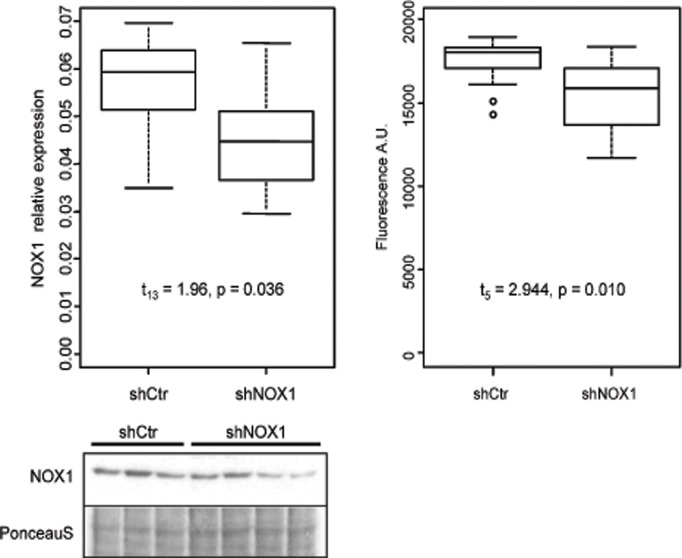
Fig 1. NOX1 and ROS levels are decreased in HepG2 cells expressing shNOX1.
NOX1 levels were determined by Western blot analysis in HepG2 cells stably expressing shRNA against NOX1 or a control shRNA. The image exemplifies a representative NOX1 Western blot. Relative protein expression is expressed as ratio between the Western blot intensity and total protein content of the sample determined from the PonceauS staining (left). Differences between groups were assessed using Welsch t-test (NshCtr = 8, NshNOX1 = 7). The dependence of the abundance of the dysregulated proteins upon NOX1 protein levels was tested in a mixed effect model with spot ID as random factor. ROS production was measured using CM-H2DCFDA assay (right). Differences in ROS levels between NOX1 reduced HepG2 cells and control cells were tested in a mixed effect model with cell type nested in replicates (N = 3).

