
Fig 1. Impaired endothelium-dependent relaxation in insulin resistant rat model and systemic amylin concentration.
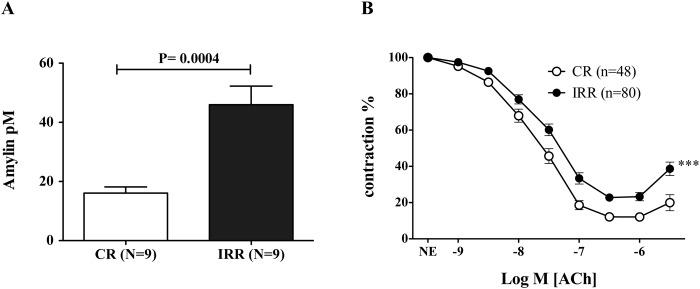
Panel A shows serum concentrations of amylin (pM) in over-night fasted control (CR) and insulin resistant rats (IRR). Data are expressed as mean±SE. N indicates the number of animals used for determinations. Samples were assessed in duplicate. p = 0.0004 versus CR by unpaired t-test. Panel B shows the relaxant response to acetylcholine (ACh; 1 nM to 10 μM) in mesenteric arterial segments derived from CR and IRR. Data are expressed as mean±SE of the remaining contraction induced by norepinephrine (NE). (n) is the number of vascular segments used for each curve. *** p < 0.0001 versus CR by two-factors ANOVA.