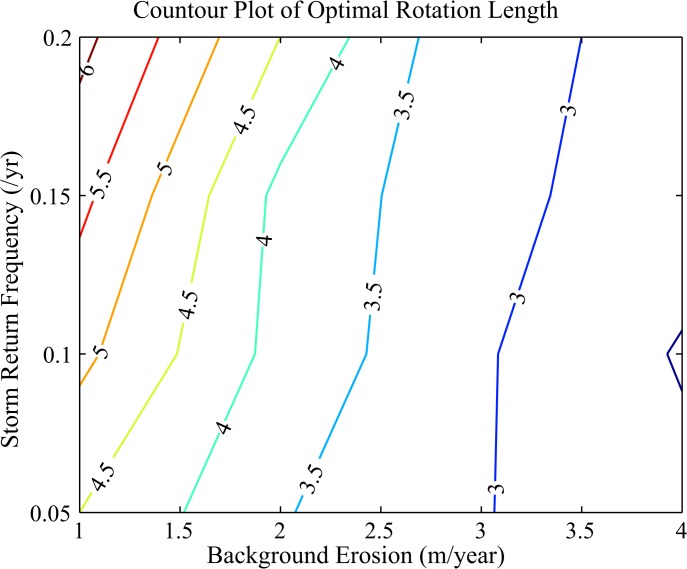
Fig 2. Optimal Intervals in Nourishment Events.
Contours for the optimal time in years between nourishment events plotted against the mean background erosion rate (m/yr) and the mean number of storms per year. Historically, the background erosion rate for North Carolina is near 1 m/yr (21). The return period for hurricanes in this region ranges between 8 and 20 years (22).

