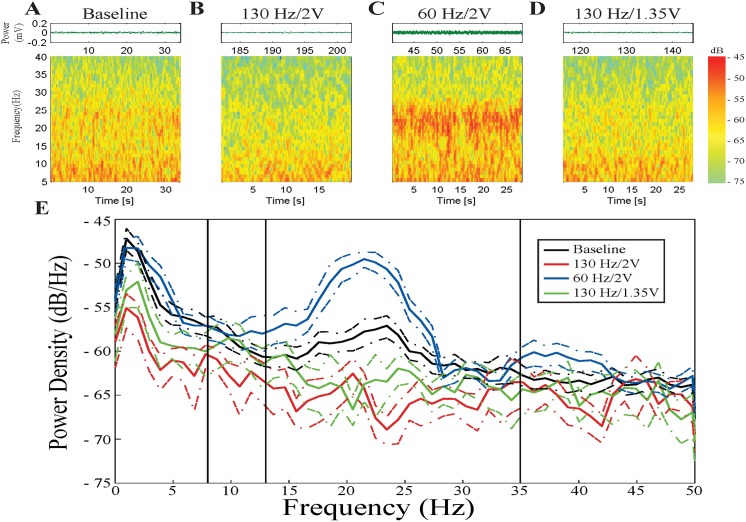
Fig 1. Example STN during the different stimulation sets.
A, B, C, and D are raw waveforms and spectrograms from the baseline epoch, 130 Hz/2V DBS epoch, 60 Hz/2V DBS epoch, and 130 Hz/1.35V DBS epoch, respectively. Spectrograms are displayed with 99% window overlap. E: Relative PSD traces of the four epochs. Black = baseline; red = 130 Hz/2V; blue = 60 Hz/2V; green = 130 Hz/1.35V. Colored dashed lines represent 95% confidence intervals for each spectrum.

