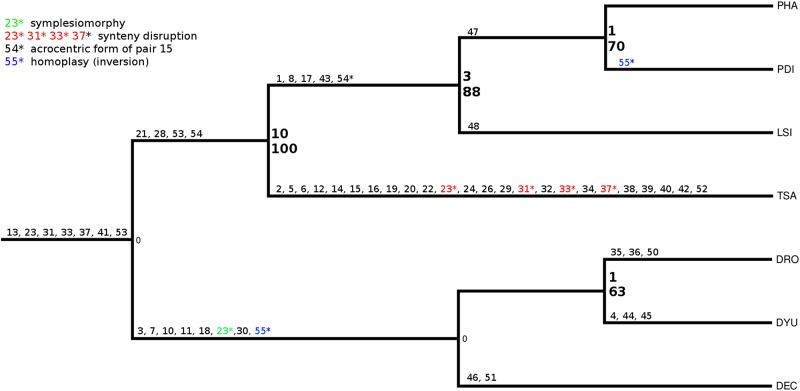
Fig 6. Cladogram obtained after the analysis by PAUP of the species PHA, PDI, LSI and TSA, using DEC, DYO, and DRO as outgroup using the chromosomal rearrangements as the unique caracters.
Bold numbers indicate Bremer test (above) and bootstrap (below) values for each branch. The numbers refers to the chromosomal changes listed on the Basic Data Matrix (S1 Table). All the chromosomal changes (55) were mapped a posteriori, including 32 autapomorphies, 15 synapomorphies, 7 plesiomorphies and one homoplasy.

