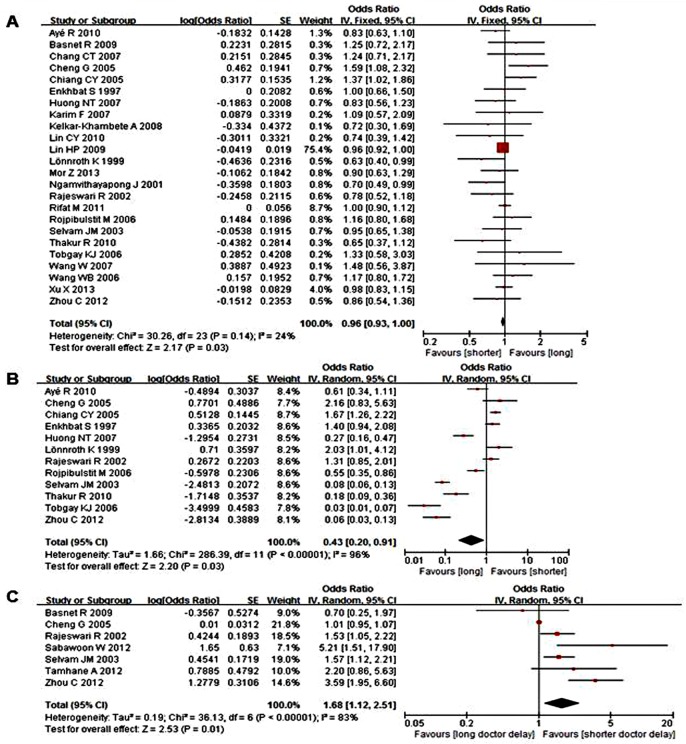
Fig 3. Forest plots of meta-analysis of factors associated with provider delay.
This figure shows forest plots for the meta-analysis of male sex factor associated with provider delay. OR and 95% CI for the factor are given. Notes: A- Male sex; B- Consult with a public hospital; C- Long travel time/distance to the first healthcare provider.

