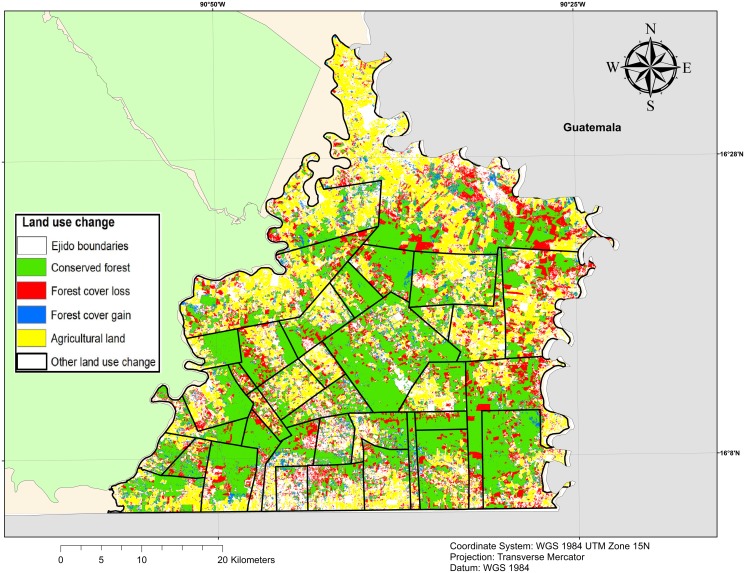
Fig 4. Land use change (2007–2013).
Land use change map is obtained by the classification of two Spot 5 images. The classification is supervised with a maximum-likelihood process completed with manual correction in areas with spectral confusion. This map present only land use changes related to forest cover and agricultural land. Source: INEGI for municipal limits, GADM for international boundaries. Ejido boundaries are authors’ elaboration and land use change map has been elaborated from Spot 5 satellite images using ERDAS IMAGINE 9.2.

