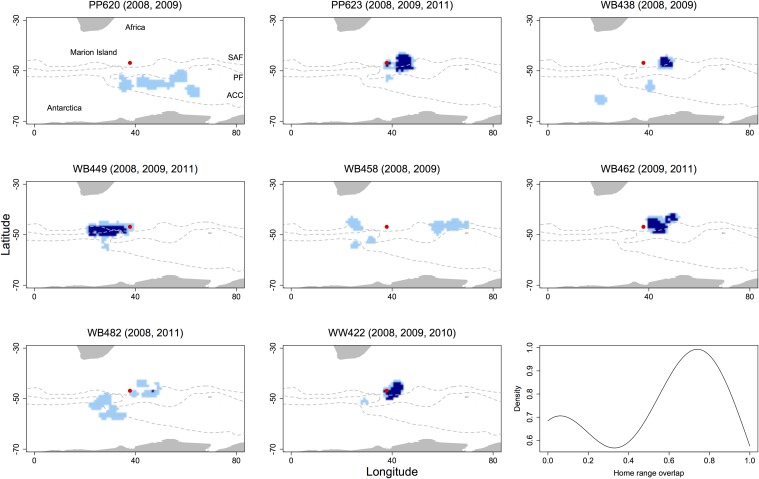
Fig 4. Multi-year foraging habitat use of eight female Antarctic fur seals from Marion Island during winter between 2008–2011.
Light blue denotes cells used in one year, dark blue denotes overlapping cells used in multiple years. Lines indicate the mean location of the sub-Antarctic front (SAF), polar front (PF) and the Antarctic circumpolar current (ACC). The density distribution of home range overlap values (Bhattacharyya’s affinity) is shown in the bottom right panel.

