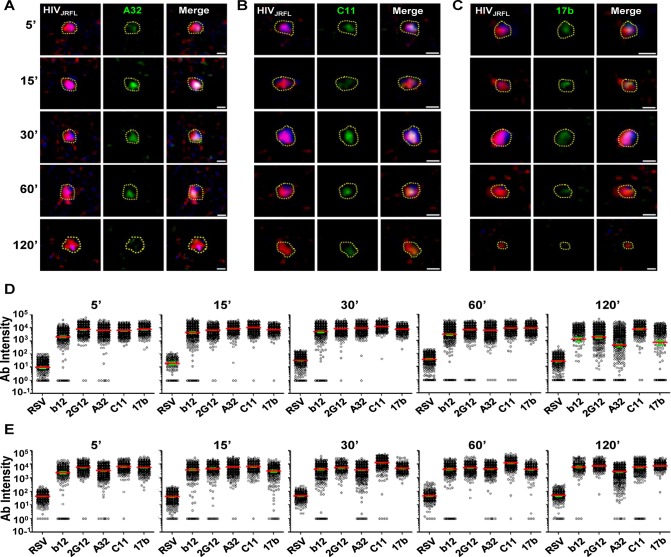
Fig 4. Gp120 epitope exposure on target cell-bound HIVJRFL virions.
Representative images of SNAP-ICAM-1 (Red) and CLIP-Vpr (Blue)-expressing HIVJRFL virions bound to TZM-bl cells are shown. Virions were further stained with anti-CD4i Mabs (Green) A32 (A), C11 (B), or 17b (C) as described in Methods. Periods of virus-cell attachment are shown. Scale bar = 1μm. The dashed yellow lines mark example ROIs selected for fluorescence intensity measurements (see Methods). Relative anti-gp120 antibody intensity signals were compiled from ROIs on TZM-bl (D) cells or HeLa-CD4 cells (E) after the indicated attachment periods and graphed as arbitrary units of intensity (a.u.i). The test Mabs are indicated; Synagis served as negative control Mab. Each experimental condition contains at least 300 ROIs. Red lines represent the geometric mean of the data; green bars indicate standard errors.

