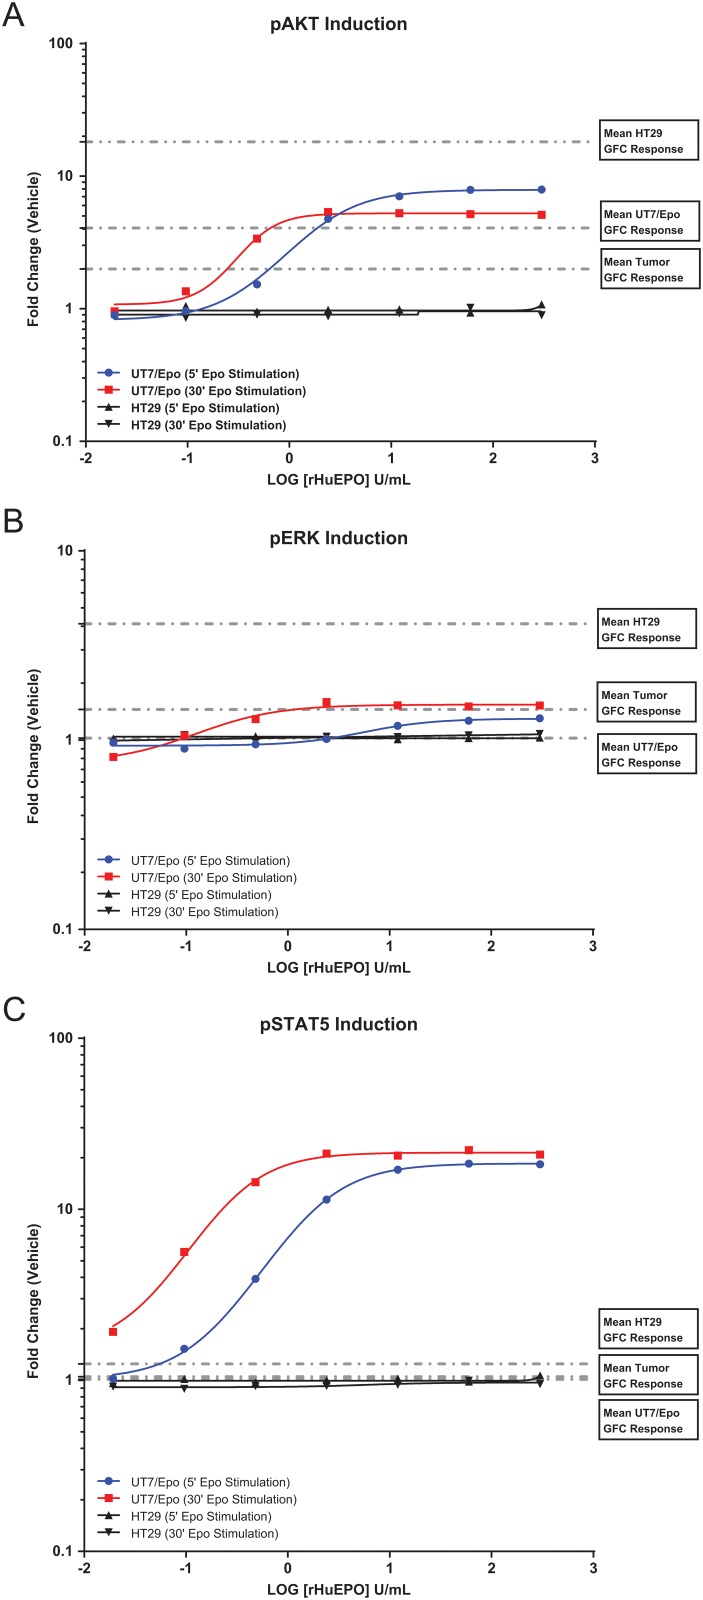
Fig 2. rHuEpo dose response curves for control cell-lines UT-7/Epo and HT29 at 5 and 30 minute stimulation time points.
Dotted lines indicate mean fold change values for growth factor stimulation (i.e. EGF/HGF/IGF1). HT29 (N = 38), UT-7/Epo (N = 38), or disaggregated human tumors (N = 181). (A) pAKT induction. For UT-7 Epo cells, the mean (± standard deviation) pAKT induction was 3.68 (±1.17) for the growth factor cocktail and 8.24 (±1.98) for Epo. For HT29 cells, the mean (± standard deviation) pAKT induction was 16.64 (±4.70) for the growth factor cocktail and 0.95 (±0.13) for Epo. (B) pERK induction. For UT-7 Epo cells, the mean (± standard deviation) pERK induction was 1.02 (±0.11) for the growth factor cocktail and 1.38 (±0.29) for Epo. For HT29 cells, the mean (± standard deviation) pERK induction was 4.12 (±0.98) for the growth factor cocktail and 1.00 (±0.07) for Epo. (C) pSTAT5 induction. For UT-7 Epo cells, the mean (± standard deviation) pSTAT5 induction was 1.02 (±0.07) for the growth factor cocktail and 16.21 (±6.56) for Epo. For HT29 cells, the mean (± standard deviation) pSTAT5 induction was 1.25 (±0.12) for the growth factor cocktail and 1.01 (±0.06) for Epo. Levels are reported as a ratio of mean fluorescent intensity (MFI) values relative to the appropriate isotype control. (Note: the ratio to isotype was used to normalize data and does not serve as baseline measure; i.e., a ratio of 1 does not imply a lack of receptor expression).

