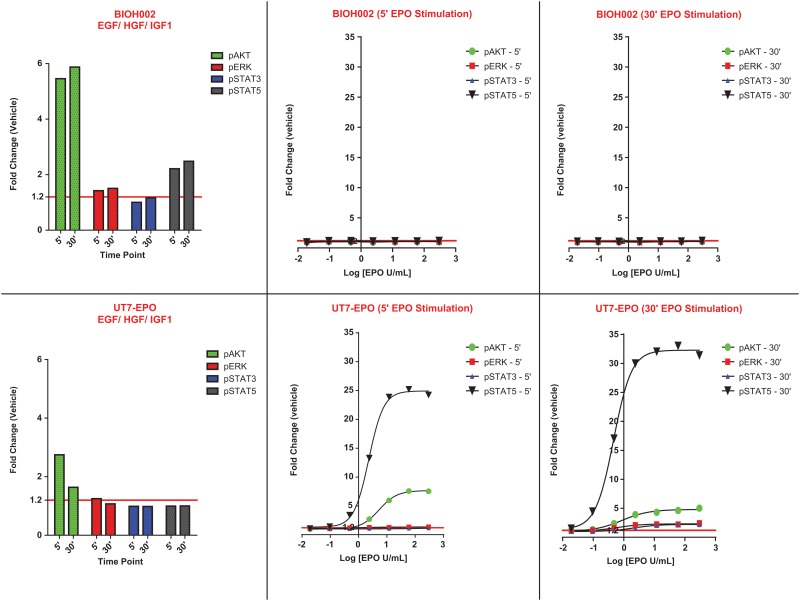
Fig 3. rHuEpo dose response curves for the control cell-line UT-7/Epo and a representative tumor sample BIOH002 (head-and-neck cancer) at 5 and 30 minute stimulation time points.
Levels are reported as a ratio of mean fluorescent intensity (MFI) values relative to the appropriate isotype control. (Note: the ratio to isotype was used to normalize data and does not serve as baseline measure; i.e., a ratio of 1 does not imply a lack of receptor expression).

