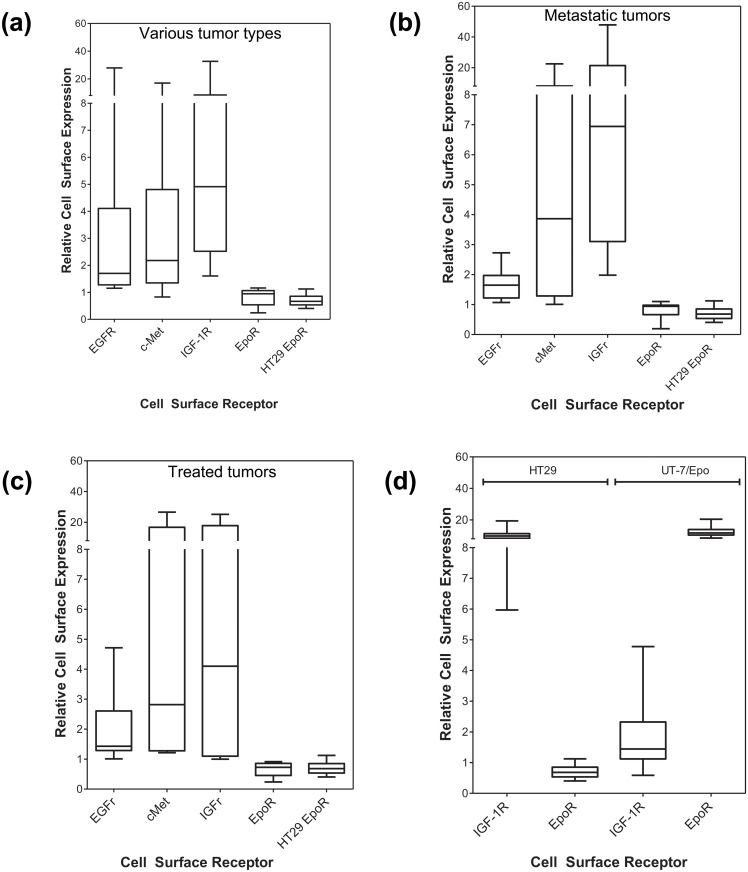
Fig 7. Levels of EpoR, IGF-1R, c-Met, and EGFR in freshly-derived tumor cell populations from human tumor tissues.
Tumors were disaggregated with dispase (0.34U/mL) and EpoR levels determined by flow cytometry. Cell-surface receptor levels are expressed as a ratio to the appropriate isotype control to allow comparison of relative levels of receptor between tissues. On each plot, the negative EpoR control cell-line (HT29) is shown for comparison (n = 44 determinations). Data shown for tumors from (A) head and neck (n = 5), gastric (n = 2), kidney (n = 3), liver (n = 1), pancreas (n = 1), esophagus (n = 1), (B) metastatic tissues (colon metastatic to liver [n = 2] ovary [n = 1], lung [n = 1], pancreatic metastatic to liver [n = 1]; local nodal metastases from breast [n = 4], lung [n = 1], ovarian [n = 2]) (C) tumors from pre-treated patients (colorectal treated with oxaliplatin and bevacizumab [n = 1], breast treated with cyclophosphamide, methotrexate, fluorouracil [n = 2], breast treated with radiation, taxotere, cytoxan, taxol, (4 cycles each) [n = 1], NSCL treated with radiation [n = 2], ovarian treated with carboplatin and taxol [n = 2]) and (D) cell-line controls.

