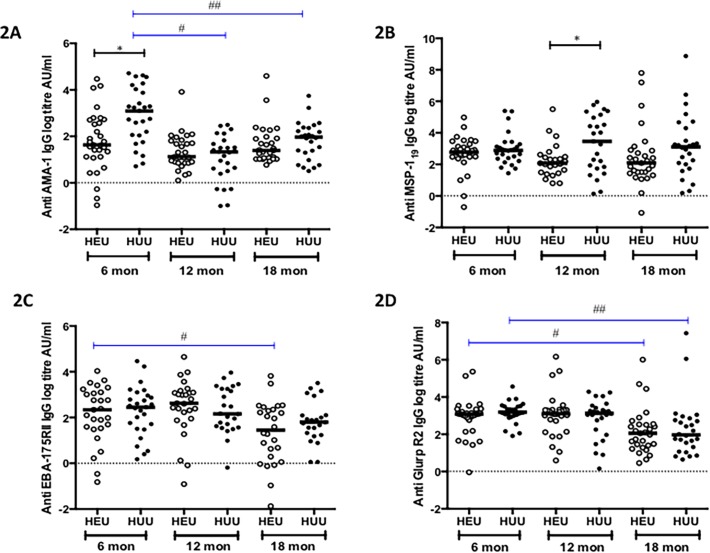
Fig 2. Specific IgG responses to P. falciparum antigens in HEU and HUU children at different ages.
Levels of specific IgG titres were measured against AMA-1 (2A), MSP-119 (2B), EBA-175RII (2C) and GLURP R2 (2D) in HEU and HUU at three time points, 6 months (during CTX prophylaxis), 12 months (At stopping CTX prophylaxis) and 18 months (6 months after CTX prophylaxis). X-axis represents age of children in months. Black horizontal bars represent medians. Black lines represent differences in the median titres between groups at each time point. Blue lines represent a significant change in levels of IgG titres from baseline in each group. Significant differences are indicated in asterices: Fig. 2A *(p = 0.0059), # (p < 0.0001), ## (p = 0.0015), Fig. 2B *(p = 0.037), Fig. 2C # (p = 0.0372), Fig. 2D # (p = 0.0107), ## (p = 0.0021).

