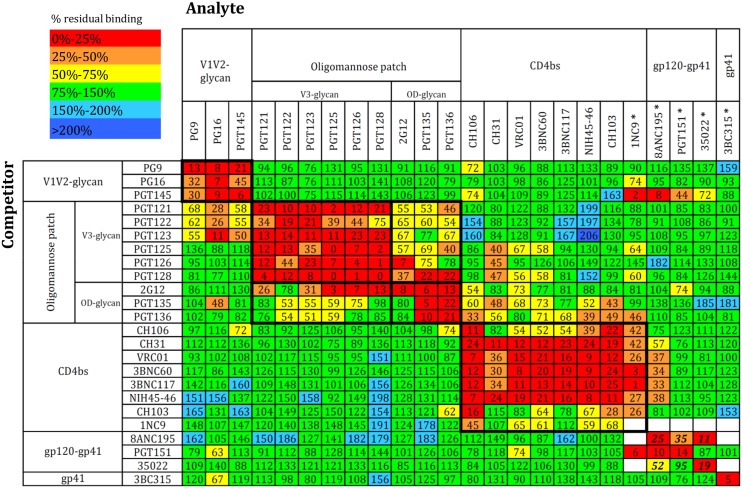
Fig 1. bNAb cross-competition matrix for the BG505 SOSIP.664 trimer.
Competitors (IgG) are listed at the left and analytes (biotinylated IgG) at the top. Some bNAbs could not be biotinylated. In those cases (indicated by *), the competitors were Fabs and the analytes were IgG. The bNAb clusters were arranged according to their location on the Env spike from top to bottom (membrane-distal to membrane-proximal). Within clusters, the bNAbs were arranged in such a way as to obtain an optimal inhibitory effect along the diagonal axis. Color-coding depicts the extent of competition or enhancement: red and orange indicate strong and intermediate inhibition, yellow indicates weak inhibition and green indicates no effect. Weak and strong enhancement effects are indicated in turquoise and blue. The numbers inside each box are derived from 6–9 independent values and indicate the percentage of residual binding of the analyte relative to the control (100%). The standard errors for all data points are plotted in the accompanying matrix in S1B Fig. The 8ANC195 Fab was unable to self-compete, and the 1NC9 and 35O22 Fabs were only weakly self-competitive. The bold numbers for 8ANC195 and 35O22 represent competition values obtained by SPR, not ELISA, and are means of two replicates.

