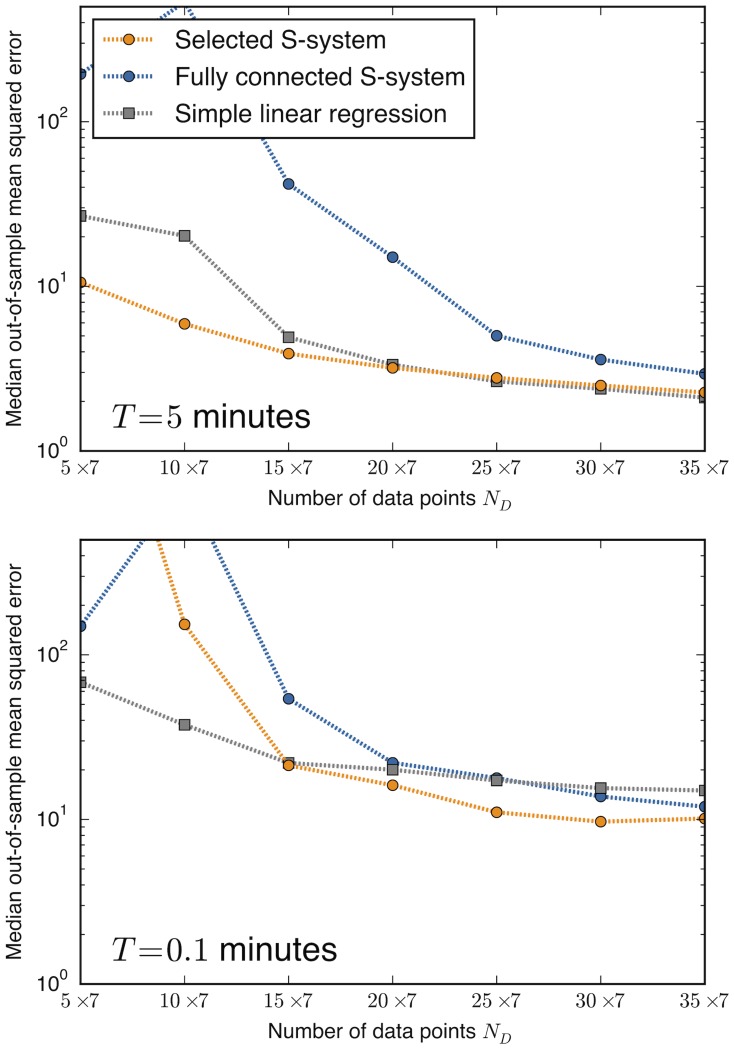
Fig 3. Mean-squared error demonstrates overfitting of fully-connected model.
Plotted are the median mean-squared errors measured using each inference method for the cases of T = 5 and 0.1 minutes (corresponding to the top two plots in Fig. 2). Decreased performance due to overfitting is evident for the fully-connected S-system models (blue). Squared errors are standardized for each species by dividing by the square of the standard deviations listed in Table 2.

