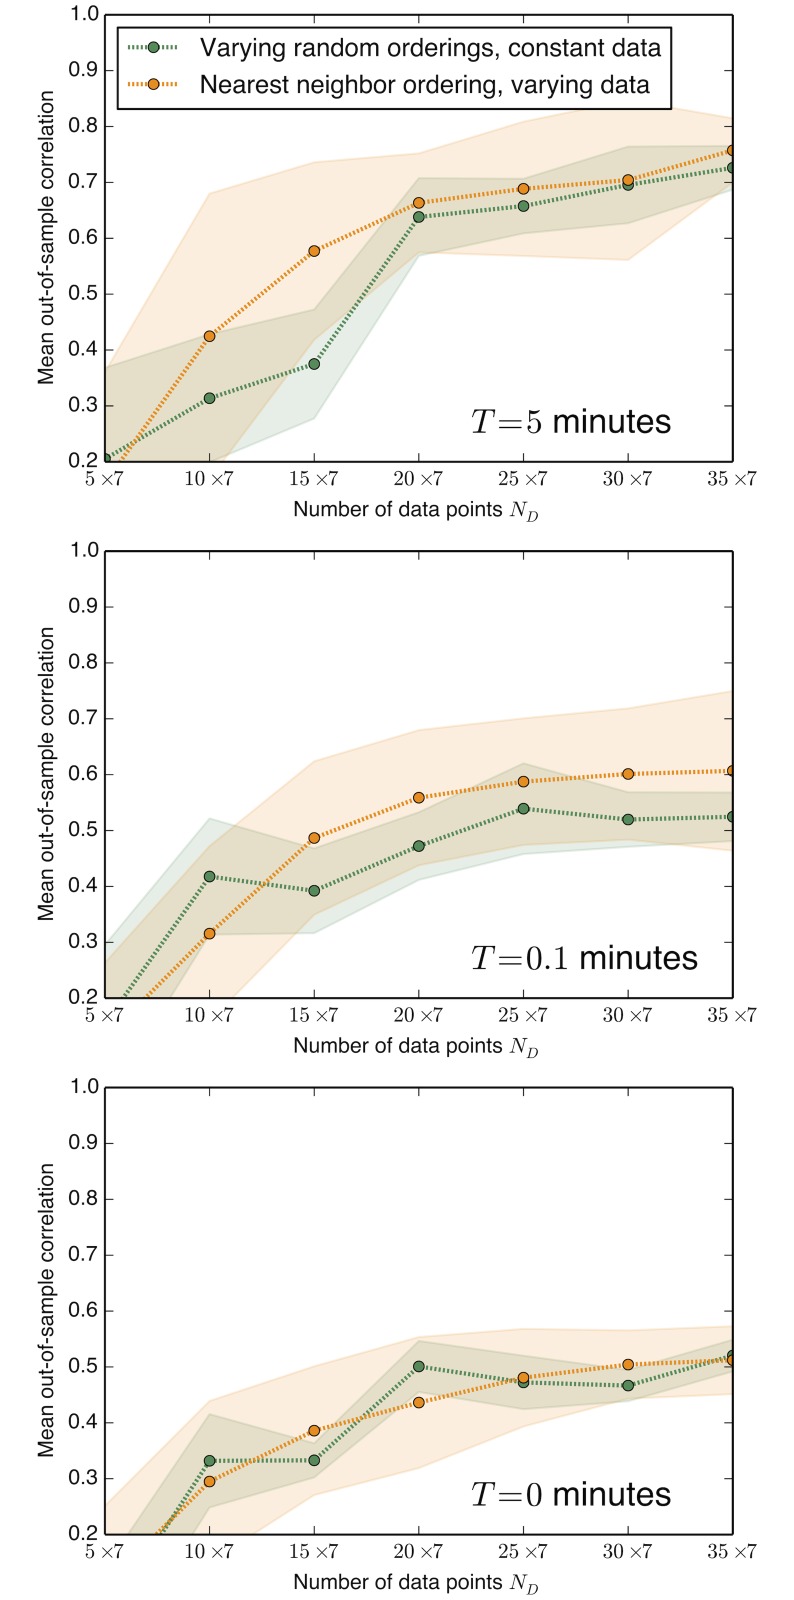
Fig 4. Testing different model hierarchies using the yeast oscillator model.
As in Fig. 2, here we plot the mean correlations of predicted and true derivative values on out-of-sample test data versus the amount of data, N. We compare different orderings of adding parameters in the model hierarchy. The variance in performance over different orderings of parameters in a random hierarchy (standard deviations plotted in green) is generally smaller than the variance caused by different random realizations of the training data for the single nearest neighbor ordering used in Fig. 2 (standard deviations plotted in orange).

