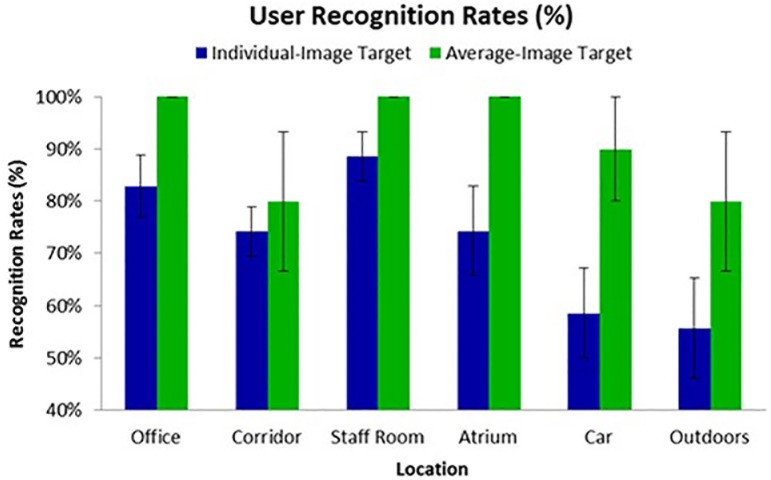
Fig 4. Mean user recognition rates for Experiment 2.
Each participant was tested against seven different individual-image targets, and one average-image target, and these tests were repeated in each of the six locations. The figure shows mean performance by condition across all participants (SD in parentheses).

