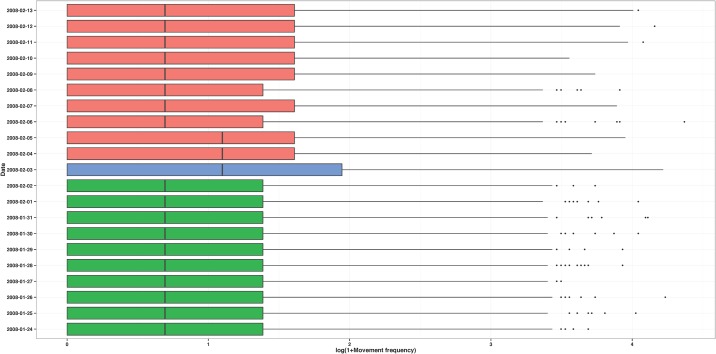
Fig 5. Movement frequency for site 361.
Mobility behavior of the people who made at least one call from at least one cellular towers located in site 361 between January 24, 2008 (10 days before the Lake Kivu earthquakes) and February 13, 2008 (10 days after the Lake Kivu earthquakes). The side-by-side boxplots represent the distribution of the movement frequency of these people on each of the 21 days.

