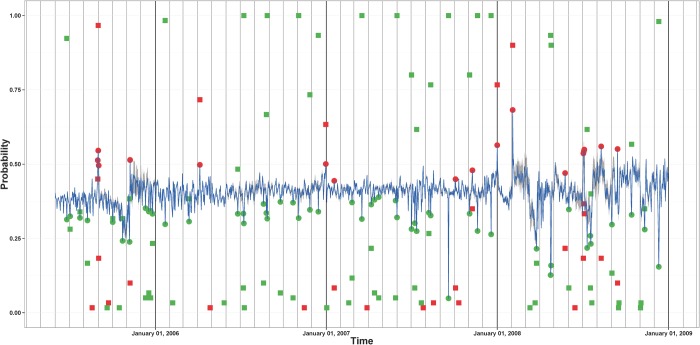
Fig 7. Daily movement frequency time series of probabilities associated with site 361.
The means of the estimated probabilities of being more mobile are shown in blue. The gray band gives the intervals between the 2.5% and the 97.5% quantiles of the estimated probabilities. The dots indicate which days in this time series are extreme positive outliers (red) and extreme negative outliers (green). The red (green) squares indicate the confidence probabilities that a day is a positive (negative) extreme outlier. The confidence probabilities are shown only for the days that have been classified as an outlier at least once.

