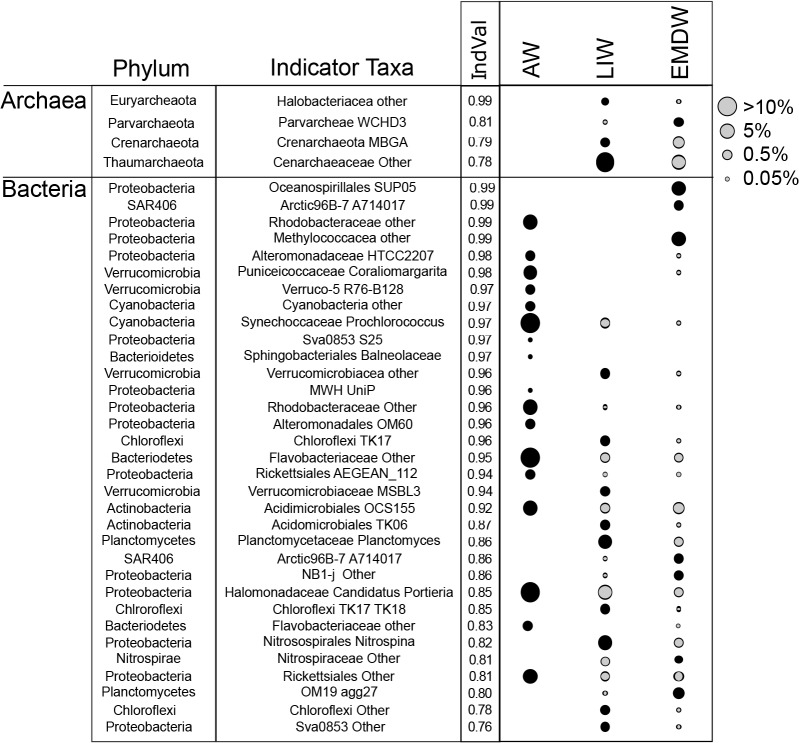
Fig 5. Indicator species analysis.
Indicator species of various water masses are shown. Indicator values (IndVal) are shown next to the taxonomic information for the indicator taxa as indicated by IndVal. Size of symbol is proportional to the mean relative abundance in that water mass. Black symbols indicate for which water mass the taxon is an indicator. Gray symbols indicate water masses that contain a taxon, but for which that taxon is not an indicator taxa.

