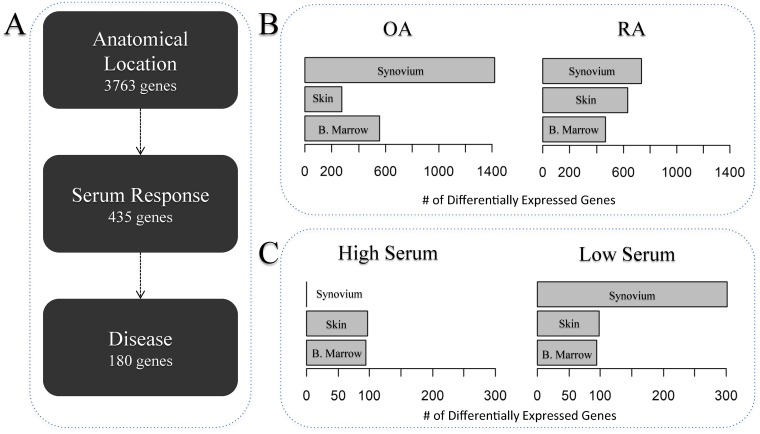
Fig 2. Differential gene expression analyses at tissue, serum and disease level.
The figure shows the differential gene expression analysis performed within each level of the study. For each level of organisation we quantified the number of differentially expressed genes at an FDR < 5% followed by a 2-fold filter. This allowed us to devise a hierarchy of organisation that follows Anatomical Location then serum response and finally disease status (A). A more detailed tissue-by-tissue analysis to identify serum response genes in RA and OA fibroblasts (B) and to identify disease genes within high and low serum (C) was then performed. The arrows in panel A represent the direction of the hierarchy defined by the number of genes differentially expressed. BoM, Bone marrow.

