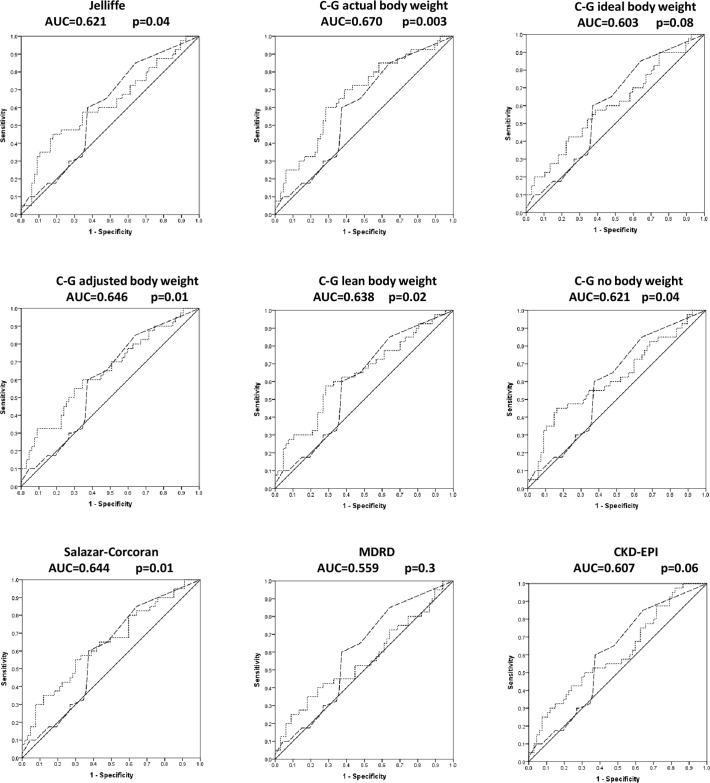
Fig 1. Receiver operator characteristic curves showing the accuracy of the eGFR equations (AUCs shown as dotted lines) in predicting plaque presence independent of the mFramingham score (AUCs shown as dashed lines).
The P values given are for the AUC-plaque associations. The mFramingham score was consistently unrelated to plaque presence (AUC = 0.596 (P = 0.1) in each analysis). EGFR = estimated glomerular filtration rate; AUC = area under the curve; C-G = Cockcroft-Gault; MDRD = Modification of Diet in Renal Disease; CKD-EPI = Chronic Kidney Disease Epidemiology Collaboration.

