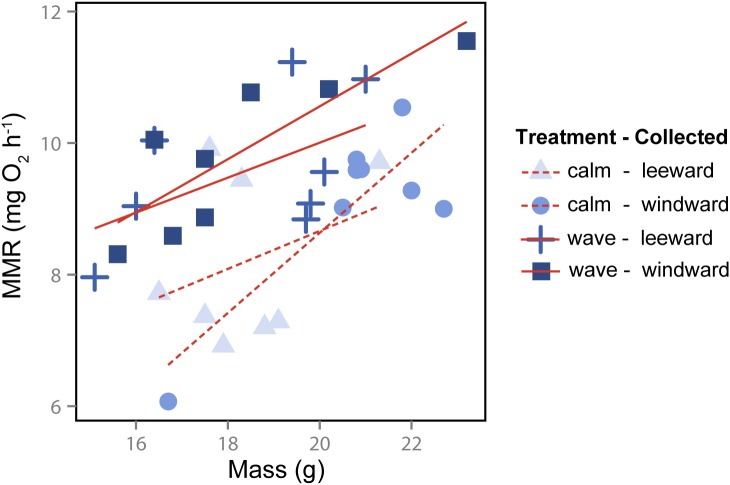
Fig 1. Maximum metabolic rate in relation to fish mass in Acanthochromis polyacanthus.
Individuals from different collection sites (leeward vs. windward) and rearing treatments (wave vs. calm) are indicates with symbols. The solid and dashed lines represent the best fit linear regressions for wave and calm treatments, respectively.

