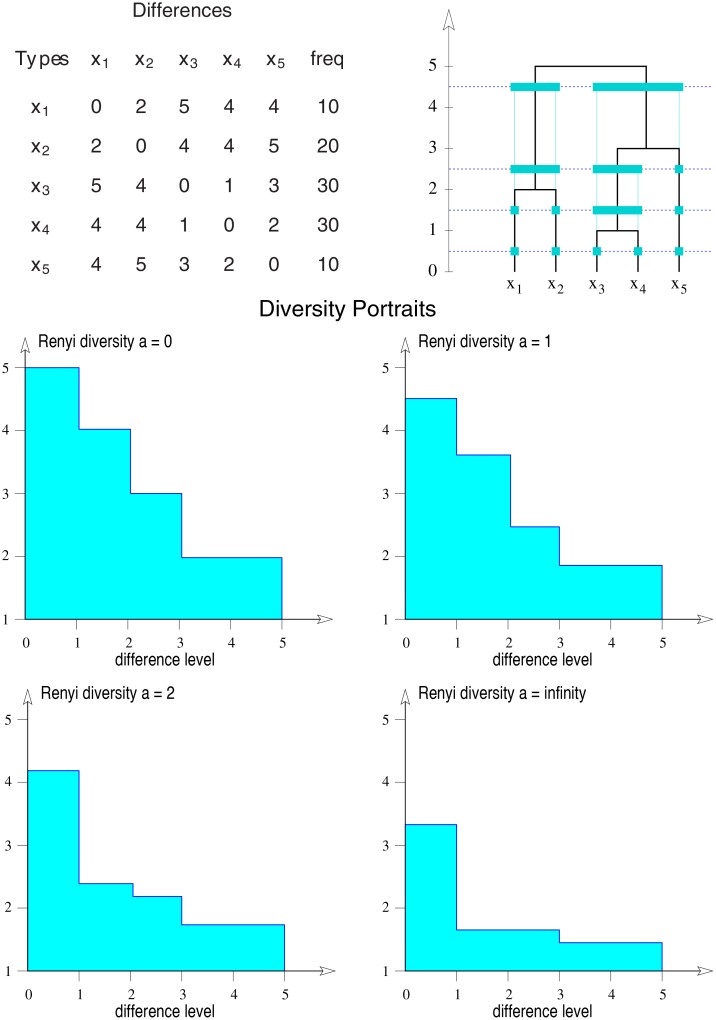
Fig 4. Diversity portraits.
Top: Difference matrix of five types and the corresponding clustering of types for increasing difference level (y-axis). In addition to the primary partition, three hierarchically organized higher order partitions arise. Bottom: Four diversity portraits based on the above difference matrix showing Rényi diversity of different orders a as functions of difference level. In all cases, the diversity function shows a stepwise decrease as the difference level increases (see [17]).

