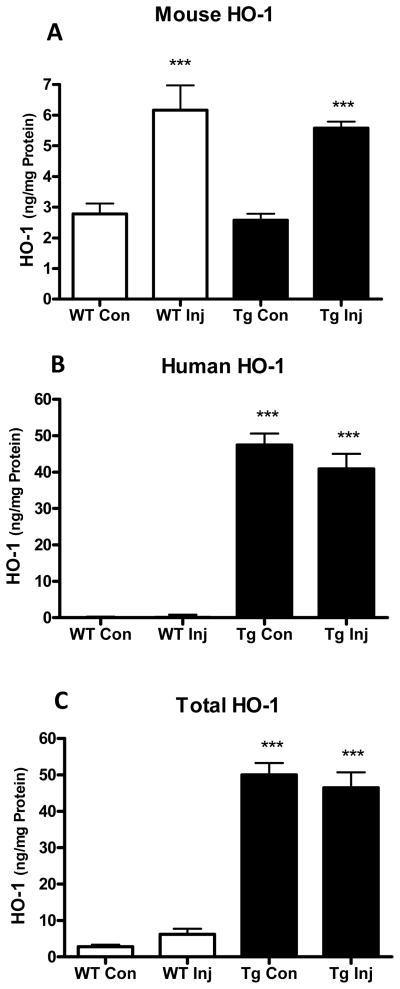
Figure 4.
Striatal HO-1 expression after ICH. Bars indicate mean mouse (A), human (B) and total (C) HO-1 in injected (Inj) and contralateral (Con) striata of WT and GFAP.HMOX1 (Tg) mice (±S.E.M., 6/condition) 7 hours after striatal blood injection. ***P < 0.001 vs. contralateral expression (A) or corresponding WT condition (B,C).

