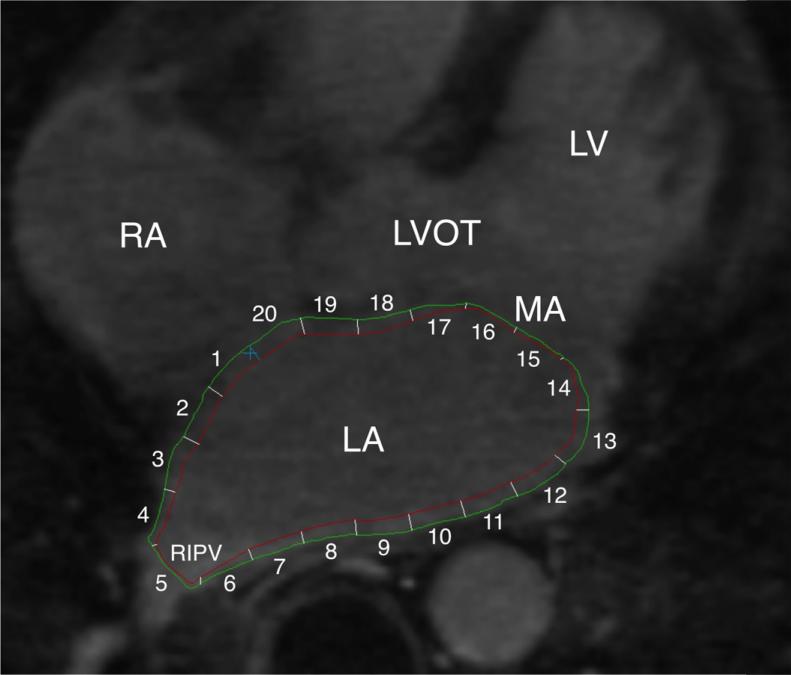
Figure 1. Endocardial and epicardial LA contours on a representative case.
The endocardial (red) and epicardial contours (green) were drawn on MPR axial image planes from LGE-MRI. LA myocardium between two contours was divided into 20 sectors and the mean pixel intensity of each sector was calculated. Pulmonary veno-atrial junction (sector 5) and the mitral valve (sectors 14-17) were excluded from analyses. Ao: aorta, LV: left ventricle, RA: right atrium, RIPV: right inferior PV.

