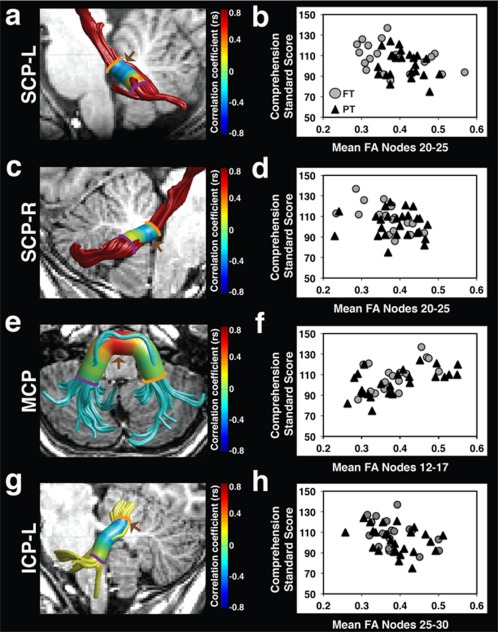
Figure 4.

FA of the left and right SCP, MCP, and left ICP is associated with comprehension skills. Strength of correlations between comprehension standard scores and FA at 30 equidistant nodes is displayed on the cylinder surrounding tract renderings for the left SCP (a), right SCP (c), MCP (e), and left ICP (g). Comprehension standard scores are negatively associated with FA of the left and right SCP (a, c), and left ICP (g) as indicated in blue. Comprehension standard scores are positively associated with FA of the MCP (e) as indicated in red. Brown arrows (a, c, e, g) indicate cluster locations where significant associations between FA and comprehension skills survived within‐tract multiple comparisons corrections. Scatter plots represent the association between comprehension standard scores and significant cluster mean FA for the left SCP (b), right SCP (d), MCP (f), and left ICP (h). Color bar represents Spearman correlation coefficients. (FA = fractional anisotropy; SCP = superior cerebellar peduncle; MCP = middle cerebellar peduncle; ICP = inferior cerebellar peduncle; L = left; R = right; FT = full term; PT = preterm; r s = Spearman correlation coefficient).
