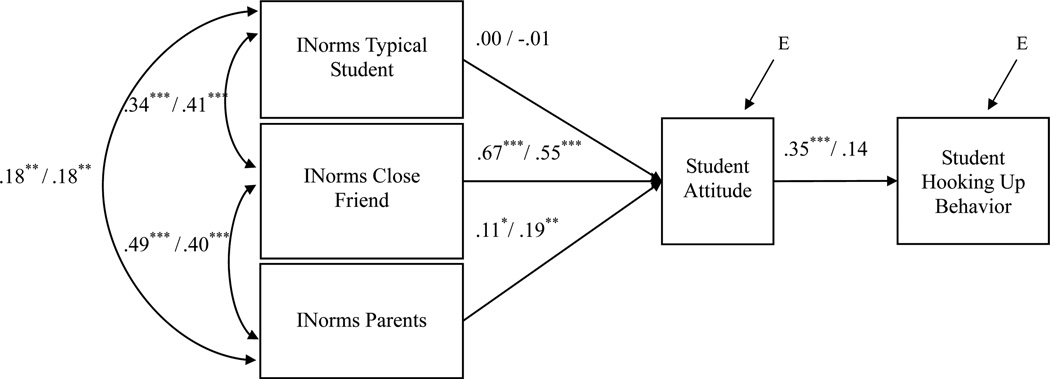
Figure 2.
Path model for males and females separately. Standardized coefficients are presented. Estimates before the slash apply to males; estimates after the slash apply to females. All paths have statistically controlled for time 1 hooking up, age and race on the endogenous variables. INorms = injunctive norms. E = predictive error. *p < .05. **p < .01. ***p < .001

