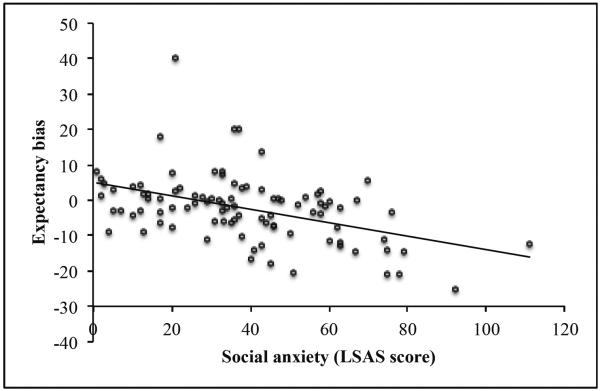
Figure 1.
General linear model of expectancy bias regressed on social anxiety (SA). A negative linear relationship between SA and expectancy bias was found, B = −.19, SE = .04, t(87) = −4.70, p < .001. Positive scores (above 0) indicate a positive expectancy bias while negative scores (below 0) indicate a negative expectancy bias. Participants with more severe SA had more negative expectations about evaluation. The model controlled for participant age, sex, ethnicity, IQ, and deception status.

