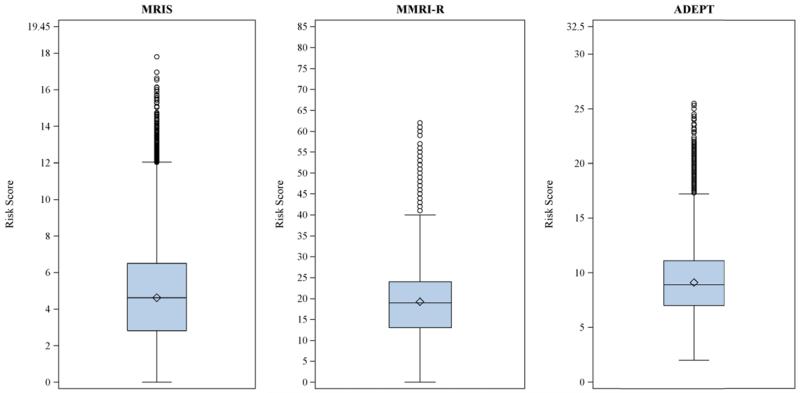
Figure 1.
Distribution of mortality risk scores in a cohort of 75,445 dually-eligible nursing home residents who initiated treatment with antipsychotic medications after admission. Box range represents interquartile range (IQR; 25th to 75th percentiles); whisker range represents values with distance ≤ 1.5*IQR; dots indicate outliers with distance > 1.5*IQR; horizontal line represents the median; diamonds indicate the means. Y-axis shows the possible range of each score.
MRIS = Mortality Risk Index Scores; MMRI-R = Mortality Risk Index Revised; ADEPT = Advanced Dementia Prognostic Tool

