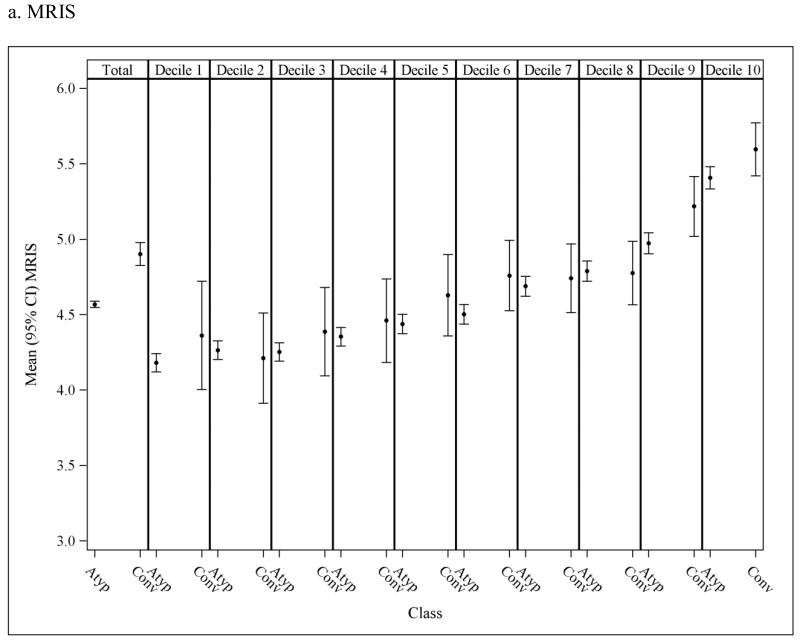
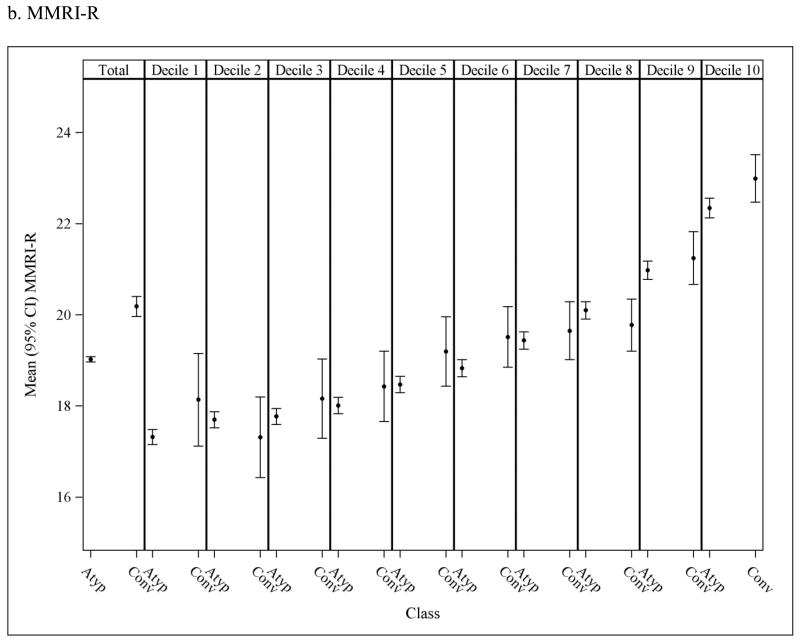
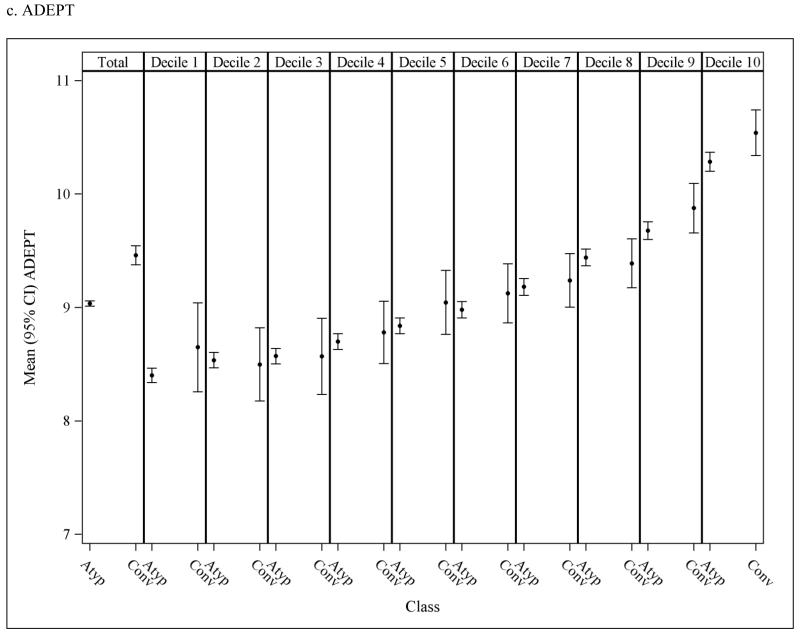
Figure 3.
Mean (95% CI) risk scores in nursing home residents initiated on atypical and conventional antipsychotic medications; observed means in the overall population (1st column) and in each propensity score (PS) decile (2nd-11th columns). Discrepancy in the mean risk scores between the two medication classes within PS decilesindicates potential residual confounding after adjusting for the PS.The y-axis was truncated to facilitate interpretation; full scale for MRIS = 0 to 19.45; MMRI-R = 0 to 85; ADEPT = 0 to 32.5.
MRIS = Mortality Risk Index Scores; MMRI-R = Mortality Risk Index Revised; ADEPT = Advanced Dementia Prognostic Tool; Atyp = Atypical; Conv = Conventional


