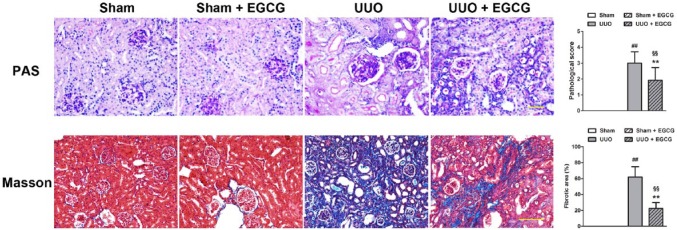
Figure 1.

Representative images of histological staining of renal sections. Renal sections were stained with PAS and Masson’s trichrome (Masson) staining. All values are the mean ± SD; n=3. ##p<0.01 versus Sham; §§p<0.01 versus Sham + EGCG group; **p<0.01 versus UUO group. Scale, 100 μm.
