
Figure 6.
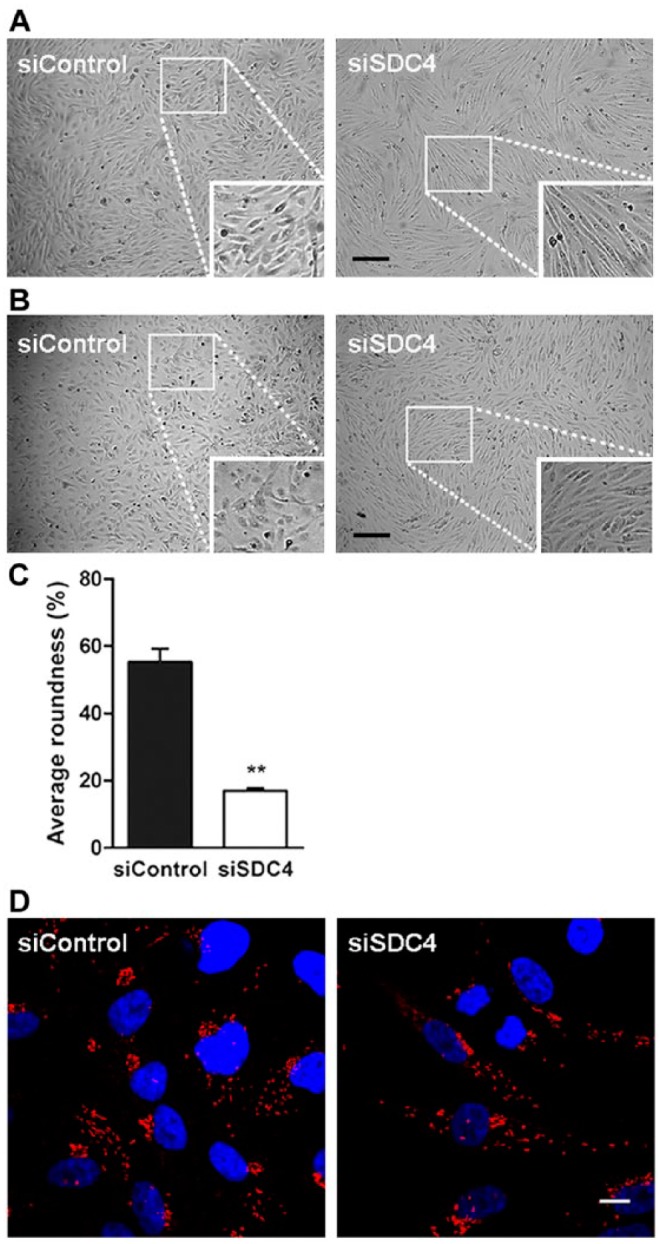
Morphology of HUVECs after syndecan-4 knock down. (A) and (B) show light microscopy images of siRNA-transfected cells from two individual cultures. The cells were transfected with control siRNA and either syndecan-4 siRNA from Santa Cruz (A) or syndecan-4 siRNA from Ambion (B), Scale, 200 µm. (C) Quantification of morphological changes, presented as the % of roundness (n=4). (D) Immunostaining of siRNA-transfected cells for the endothelial marker, von Willebrand factor (vWF), showing the same phenotype in both siControl and siSDC4 cells. Scale, 10 µm. The results show one representative out of three donors. A value of p<0.05 is considered a statistically significant difference. **p<0.01.