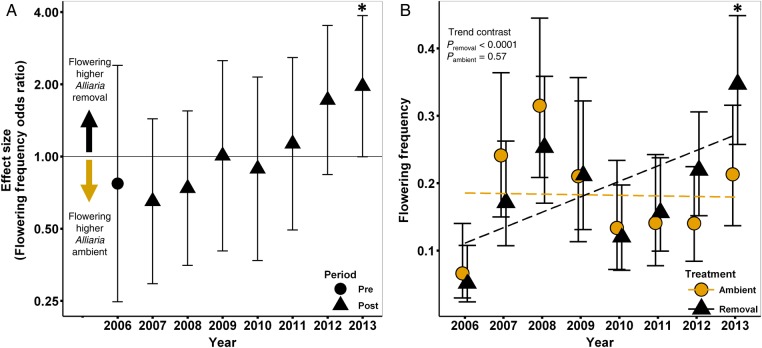
Figure 3.
Effect of Alliaria on Maianthemum flowering frequency. (A) Mean difference (effect size, ES) in flowering frequency in Alliaria-ambient and removal plots. Effect size is expressed as an OR and plotted on the log scale. (B) Annual mean flowering frequencies for both treatments and ANOVA trend contrasts. Error bars represent ±95 % CIs. Asterisk indicates a significant effect of Alliaria removal (P < 0.05).

