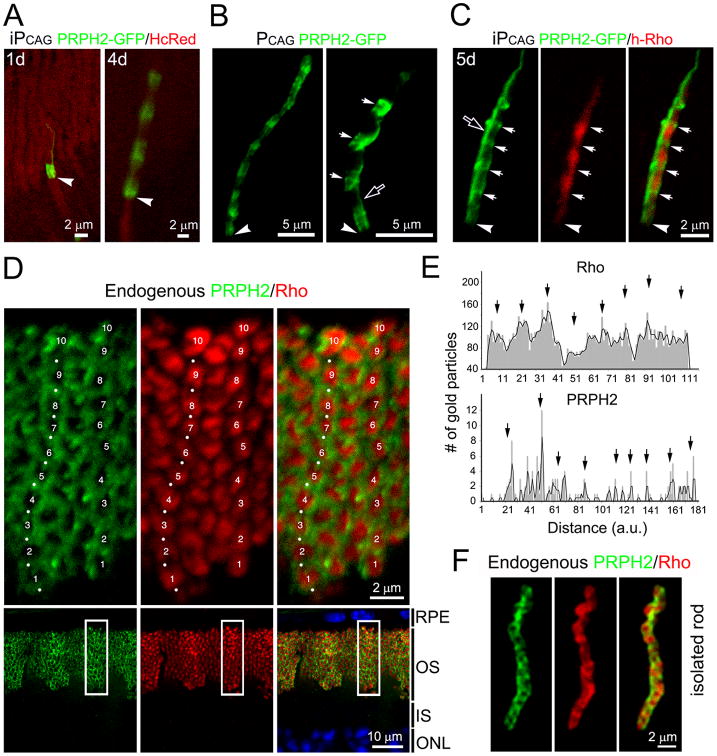
Figure 4. OS discs enriched with rhodopsin and PRPH2 are alternately arrayed.
(A) Representative rods co-transfected with iPCAG-PRPH2-GFP and PCAG-HcRed harvested 1 day or 4 days post 4OH induction. (B) Left: a rod constitutively expressing PRPH2-GFP. Right: a highly magnified view of PRPH2-GFP+ bands, which had a more irregular shape (arrows). (C) 3A6 mAb immunolabeling of a rod co-transfected with iPCAG- PRPH2-GFP and iPCAG-hRho for 5 days. Arrows point to the bands containing strong PRPH2-GFP but weak hRho signals. Arrowheads in (A-C) point to the IS-OS junctions; open arrows in (B, C) show the PRPH2-GFP+ signals longitudinally aligned with the OS axoneme. (D) C57BL6/J mouse retinal slice pretreated with neuraminidase and labeled for endogenous PRPH2 (green, white dots) and rhodopsin (red) using 5H2 mAb and C107 rabbit Abs, respectively. Top panels show the enlarged views of the boxed areas in the bottom panels. Numbers 1 to 10 mark the 10 distinguishable segments containing a higher level of rhodopsin and a lower level of PRPH2 in two rod OS. (E) The numbers of immunogolds that labeled endogenous rhodopsin and PRPH2 were plotted against the distance from the basalmost (zero) to the distalmost OS in arbitrary units (a.u.); black arrows point to the peak signals. Representative results of one rod for each molecule (out of total 6 rods examined) are shown. (F) Representative image of a dissociated rod co-labeled for endogenous PRPH2 (green) and rhodopsin (red). See also Figure S4 and Movie 1.

