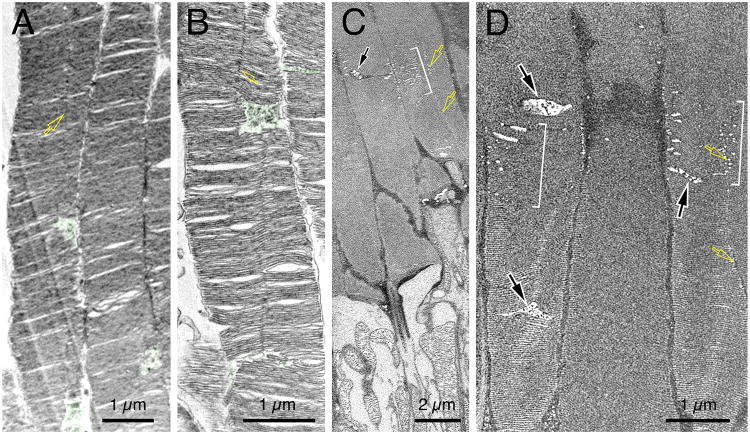
Fig. 6. Ultrastructural analysis of the OS heterogeneity and OSCPs.
(A, B) TEM examination of the longitudinal sectioning views of the proximal-to-middle section of mouse rod OS. The characteristic OSCPs were highlighted in green. The vertical lines running along the OS axis represent the incisures that aligned along the stacked discs (yellow arrows). (C, D) Two representative block-face images of mouse rod OS examined by FIM-SEM. Brackets mark discs had obviously porous appearance. Black arrows point to the characteristic OSCP. Yellow arrows point to incisures. (C) is a still image representing a partial area of Movie 4. See also Figures S5 and S6.

