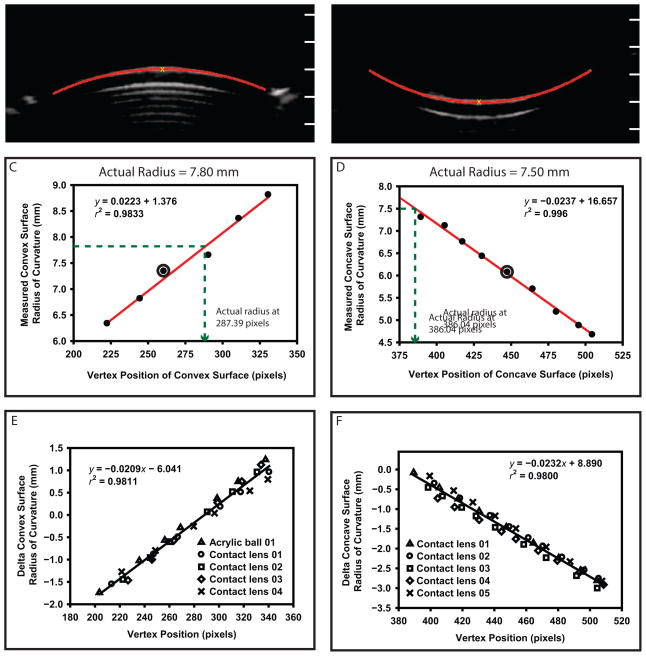
Figure 3.
The UBM image analysis of a convex (A) and concave (B) calibration surface. The y-axis tick marks superimposed on the images represent the y-axis pixel positions in the UBM images. The measured radius of curvature of the convex surface (C) and is compared with that of the concave surface (D) as a function of vertex distance. The circled points represent the 2 corresponding images in A and B above. The actual radius for the convex surface and the concave surface was calculated at vertex-y pixel positions of 287.39 and 386.04, respectively (dashed lines). Calibration functions for the convex (E) and concave (F) calibration surfaces. Note that E includes 1 acrylic ball and 4 contact lenses.

