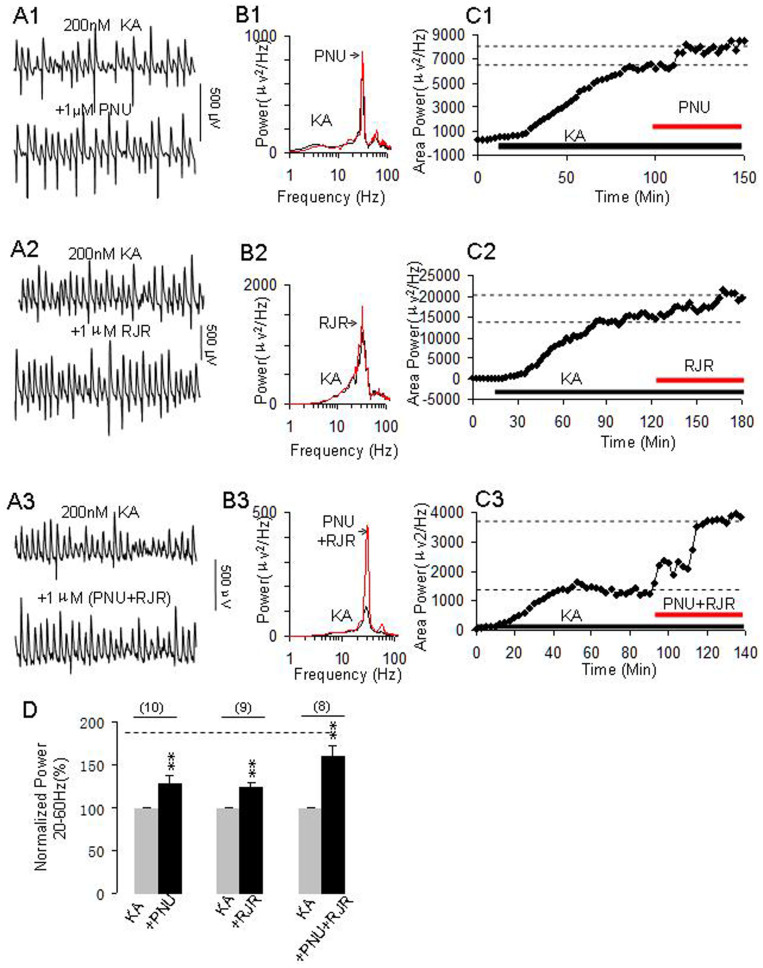
Figure 2. The effects of selective nAChR agonists on γ oscillations.
(A1–A3) Representative extracellular recordings of KA-induced field potentials before and after application of α7 nAChR agonist PNU282987 (PNU, 1 μM) (A1), α4β2 nAChR agonist RJR2403 (RJR, 1 μM) (A2) and PNU + RJR (A3). The 1-second waveforms were taken from the steady states under various conditions. (B1–B3) The power spectra of KA-induced field potentials before and after applications of PNU (B1), RJR (B2) and PNU + RJR (B3). (C1–C3) The time course shows the changes in γ power before and after application of PNU (C1), RJR (C2) and PNU + RJR (C3). (D): Bar graph shows the effects of PNU, RJR or PNU + RJR on γ power. Gray bars: Normalized γ power in control (100%, KA alone), Black bars: percent changes in γ powers after application of PNU (n = 10), RJR (n = 9) or PNU + RJR (n = 8). **p < 0.01, compared with control, one way RM ANOVA. The dashed horizontal line located at the top of the graph D indicates the level of percentage change on γ oscillations induced by nicotine (1 μM) alone.

