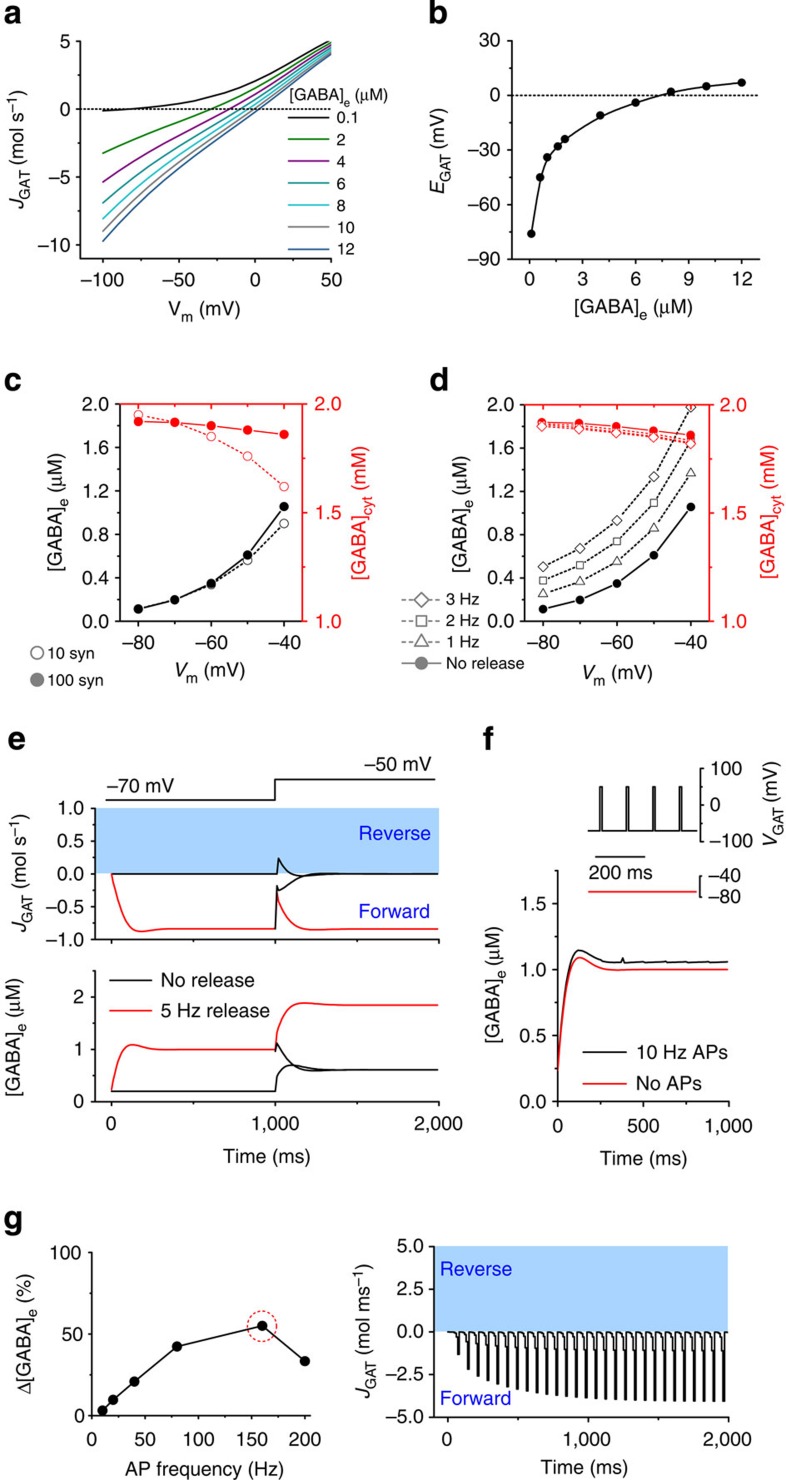
Figure 1. GAT-1 activity and [GABA]e simulations.
(a) Current–voltage relationship of the steady-state GAT-1-mediated current (JGAT, molecules s−1; negative values—forward mode, positive values—reverse mode) at different concentrations of extracellular GABA (in μM). (b) Dependence of GAT-1 reversal potential (EGAT) on the concentration of extracellular GABA. (c) Membrane potential dependence of the steady-state cytosolic ([GABA]cyt; red symbols) and extracellular GABA concentrations ([GABA]e; black symbols) in the absence of synaptic release. Filled circles—for 100 synapses, open circles—for 10 synapses. (d) Membrane potential dependence of the steady-state [GABA]cyt and [GABA]e at various rates of synaptic release. (e) The effect of depolarization on the dynamics of GAT-1 operation and [GABA]e with (red) and without (black) synaptic GABA release. (f) The effect of presynaptic depolarization due to action potentials on the accumulation of extracellular GABA. Inset: simulated voltage changes. (g) Left: an increase in [GABA]e due to presynaptic spike-induced depolarization at different firing frequencies (% change compared with [GABA]e in the absence of simulated presynaptic action potentials). Right: GAT-1 current dynamics at 160 Hz presynaptic firing frequency.

